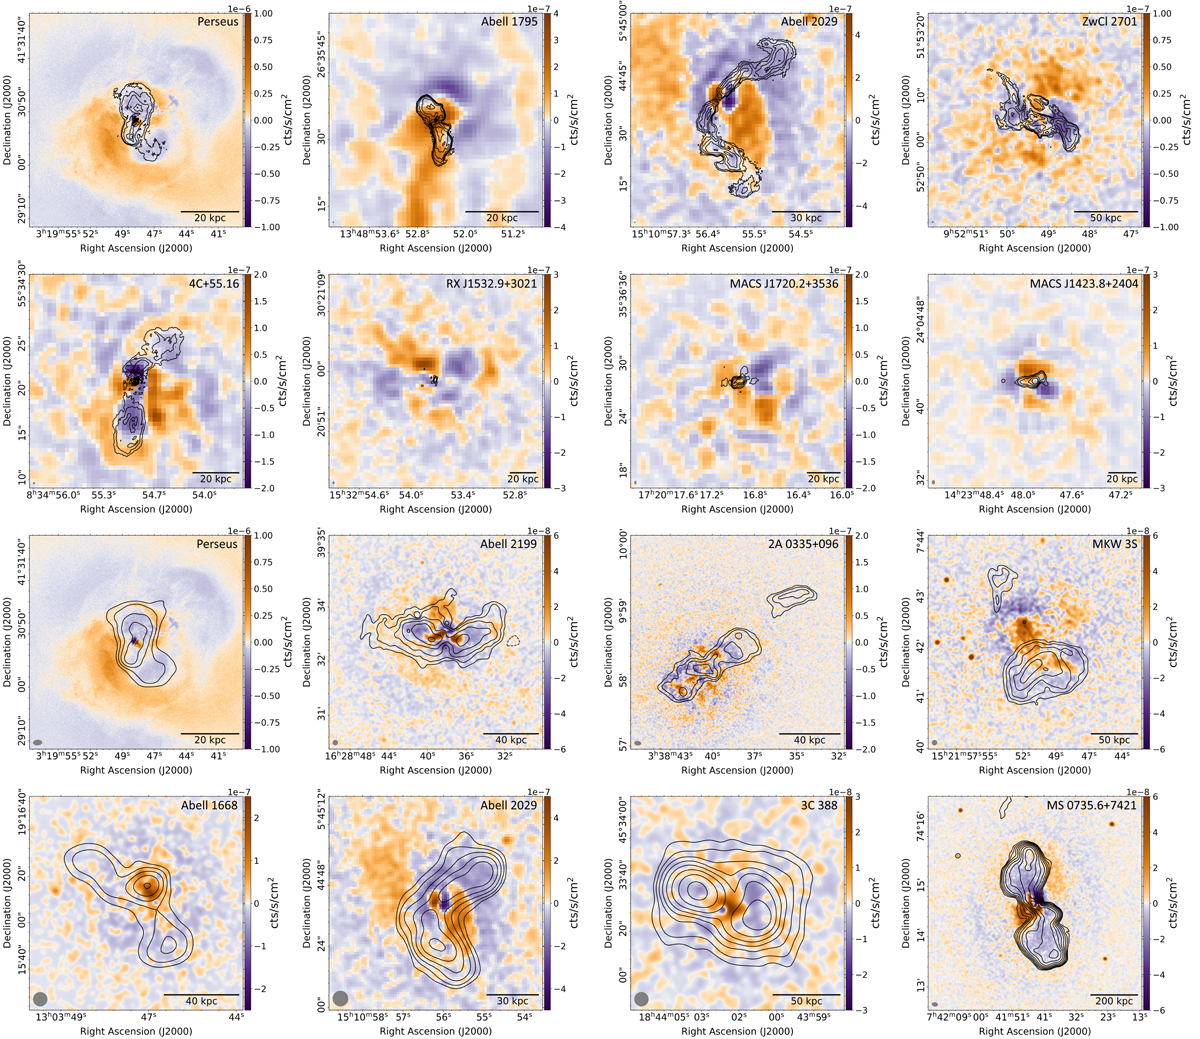
Fig. 2.
Download original image
Residuals from the Chandra X-ray images after subtracting a smooth model of the ICM surface brightness. Top 8 panels: X-ray residual maps corresponding to the high-resolution sample and the bottom 8 panels show the X-ray residual maps corresponding to the low-resolution sample. We note that Perseus and Abell 2029 are presented in both sections. The orange and purple colors indicate regions with surface brightness excess and deficiency, respectively. The black contours indicate the radio emission, and are drawn in increments of factors of 2, starting at 5 times the rms noise level. The scale bar in the bottom right corner of each panel measures the listed length at the redshift of the respective clusters. The beam is indicated in gray in the bottom left corner of each panel.
Current usage metrics show cumulative count of Article Views (full-text article views including HTML views, PDF and ePub downloads, according to the available data) and Abstracts Views on Vision4Press platform.
Data correspond to usage on the plateform after 2015. The current usage metrics is available 48-96 hours after online publication and is updated daily on week days.
Initial download of the metrics may take a while.