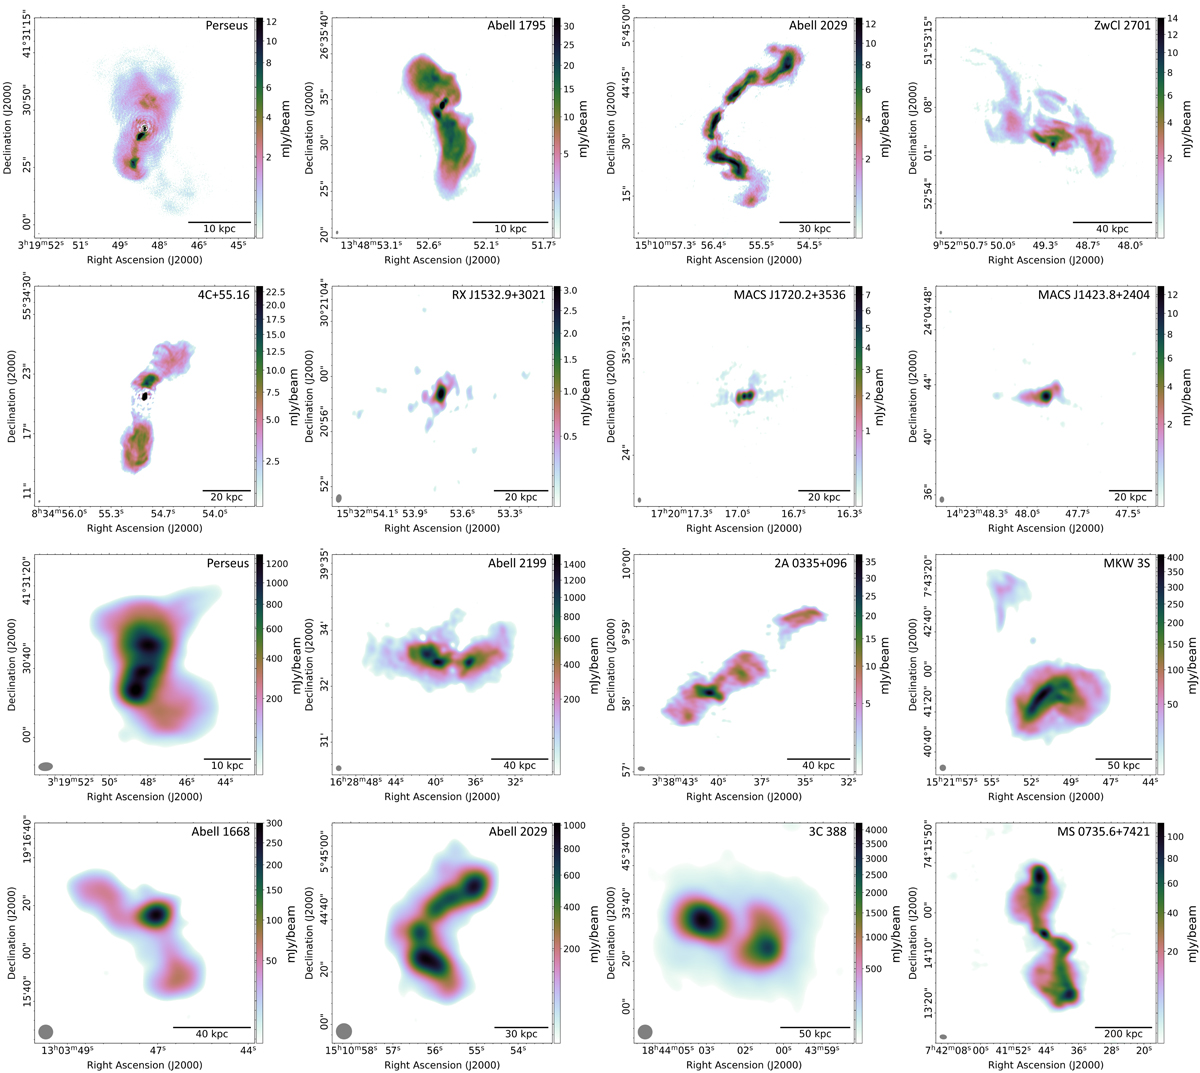
Fig. 1.
Download original image
LOFAR images of all galaxy clusters our the sample. Top 8 panels: the high-resolution maps produced by including LOFAR’s international stations and the bottom 8 panels show the low-resolution maps produced using only the Dutch part of the array. We note that Perseus and Abell 2029 are presented in both sections. The central dominant compact component in the Perseus cluster was peeled from the data for the low-resolution map for calibration purposes. The color maps range from three times the rms noise level to the peak brightness, except in the cases of Perseus, Abell 1795 and 4C+55.16, for which the peak brightness of the lobes was used due to the otherwise dominant central compact component. The scale bar in the bottom right corner of each panel measures the listed length at the redshift of the respective clusters. The beam is indicated in gray in the bottom left corner of each panel.
Current usage metrics show cumulative count of Article Views (full-text article views including HTML views, PDF and ePub downloads, according to the available data) and Abstracts Views on Vision4Press platform.
Data correspond to usage on the plateform after 2015. The current usage metrics is available 48-96 hours after online publication and is updated daily on week days.
Initial download of the metrics may take a while.