Fig. 8
Download original image
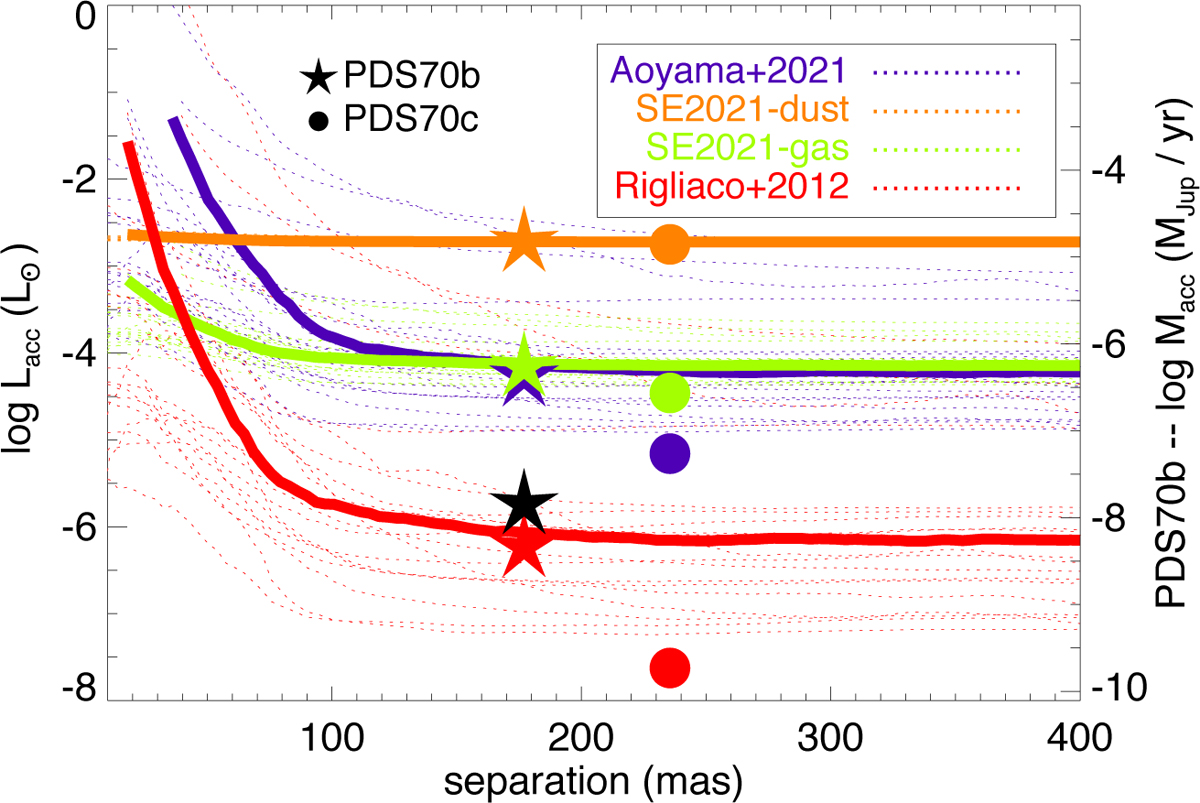
Accretion luminosities estimated from the ![]() contrast curves, and using four different relations given in Eqs. (2)-(5) (see text). These four relationships are represented with different colors as described in the upper right panel of the figure. The dotted lines correspond to all the individual objects observed in this work and in Zurlo et al. (2020), while the thick solid lines represent the results for RXJ1615 (as an average case) to highlight the difference between the four models. We represent the estimated Lacc values for planets PDS70b (starred symbols) and PDS70c (filled circles) using the four models. For completeness, we include the Lacc value of PDS70b estimated by Zhou et al. (2021) using a slab model (black star). The corresponding Macc values for planet PDS70b, assuming a planet mass of 1 MJup and a planet radius of 1.75 RJup, are displayed on the right y-axis.
contrast curves, and using four different relations given in Eqs. (2)-(5) (see text). These four relationships are represented with different colors as described in the upper right panel of the figure. The dotted lines correspond to all the individual objects observed in this work and in Zurlo et al. (2020), while the thick solid lines represent the results for RXJ1615 (as an average case) to highlight the difference between the four models. We represent the estimated Lacc values for planets PDS70b (starred symbols) and PDS70c (filled circles) using the four models. For completeness, we include the Lacc value of PDS70b estimated by Zhou et al. (2021) using a slab model (black star). The corresponding Macc values for planet PDS70b, assuming a planet mass of 1 MJup and a planet radius of 1.75 RJup, are displayed on the right y-axis.
Current usage metrics show cumulative count of Article Views (full-text article views including HTML views, PDF and ePub downloads, according to the available data) and Abstracts Views on Vision4Press platform.
Data correspond to usage on the plateform after 2015. The current usage metrics is available 48-96 hours after online publication and is updated daily on week days.
Initial download of the metrics may take a while.