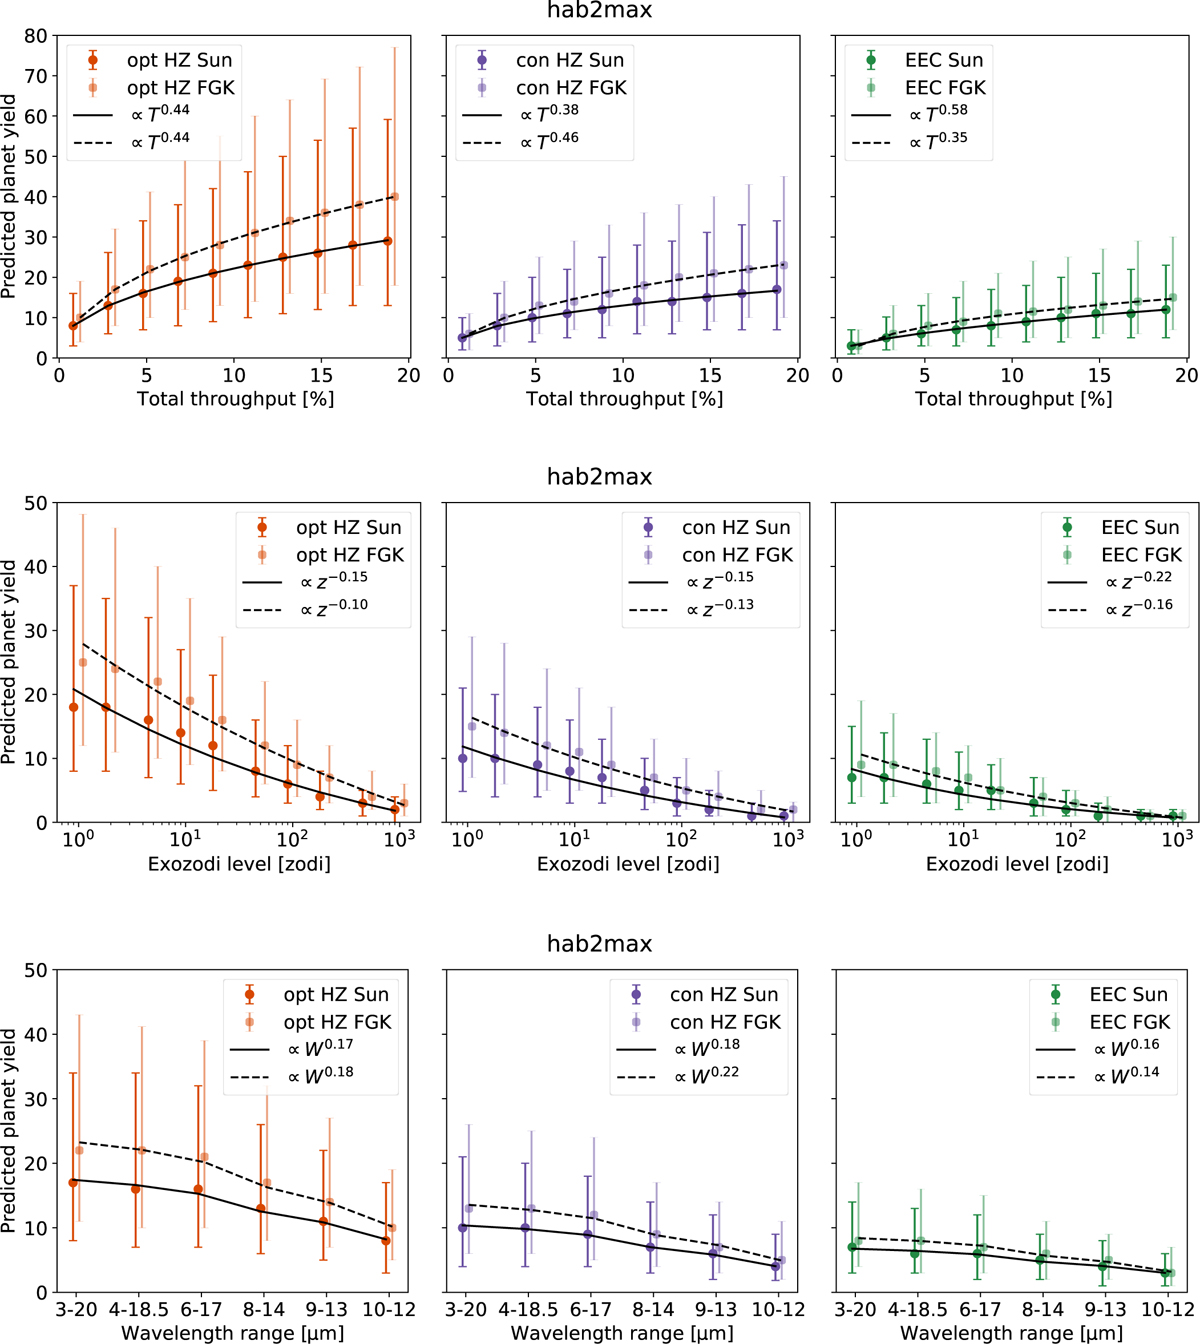
Fig. 9
Download original image
Same as Fig. 8, but for different mission and astrophysical parameters. The mirror size is kept constant at 2 m. The top three panels show the predicted yield as a function of the total throughput T from 1% to 19% in steps of 2%. The middle three panels show the predicted planet yield as a function of the exozodiacal dust level z from 1 zodi to 1000 zodi in logarithmic steps of log10(∆z) ~ 0.3. The bottom three panels show the predicted planet yield for different wavelength ranges. In the latter case, the overlaid power laws are functions of the width W of the wavelength range, and the x-axes do not scale linearly with W.
Current usage metrics show cumulative count of Article Views (full-text article views including HTML views, PDF and ePub downloads, according to the available data) and Abstracts Views on Vision4Press platform.
Data correspond to usage on the plateform after 2015. The current usage metrics is available 48-96 hours after online publication and is updated daily on week days.
Initial download of the metrics may take a while.