Open Access
Fig. A.2.
Download original image
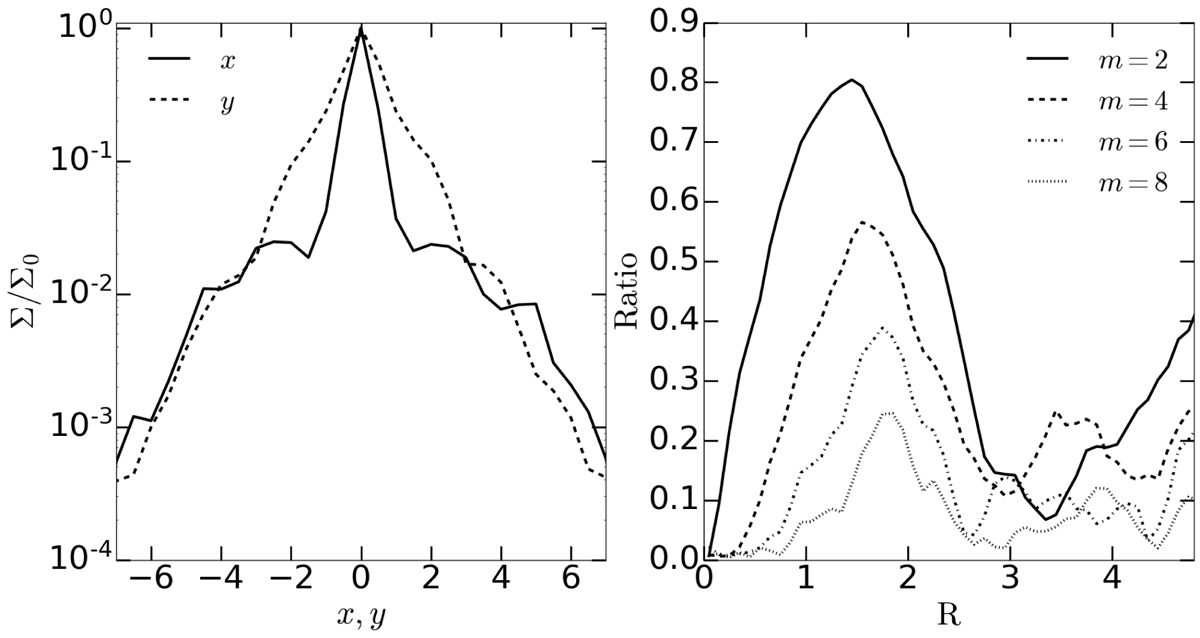
Basic information on our simulated model. Left: Projected density profiles along the bar major (dashed line) and minor (solid line) axes. Right: Ratio of the amplitude of ![]() for the even terms of the mass of the disc particles.
for the even terms of the mass of the disc particles.
Current usage metrics show cumulative count of Article Views (full-text article views including HTML views, PDF and ePub downloads, according to the available data) and Abstracts Views on Vision4Press platform.
Data correspond to usage on the plateform after 2015. The current usage metrics is available 48-96 hours after online publication and is updated daily on week days.
Initial download of the metrics may take a while.