Fig. 6.
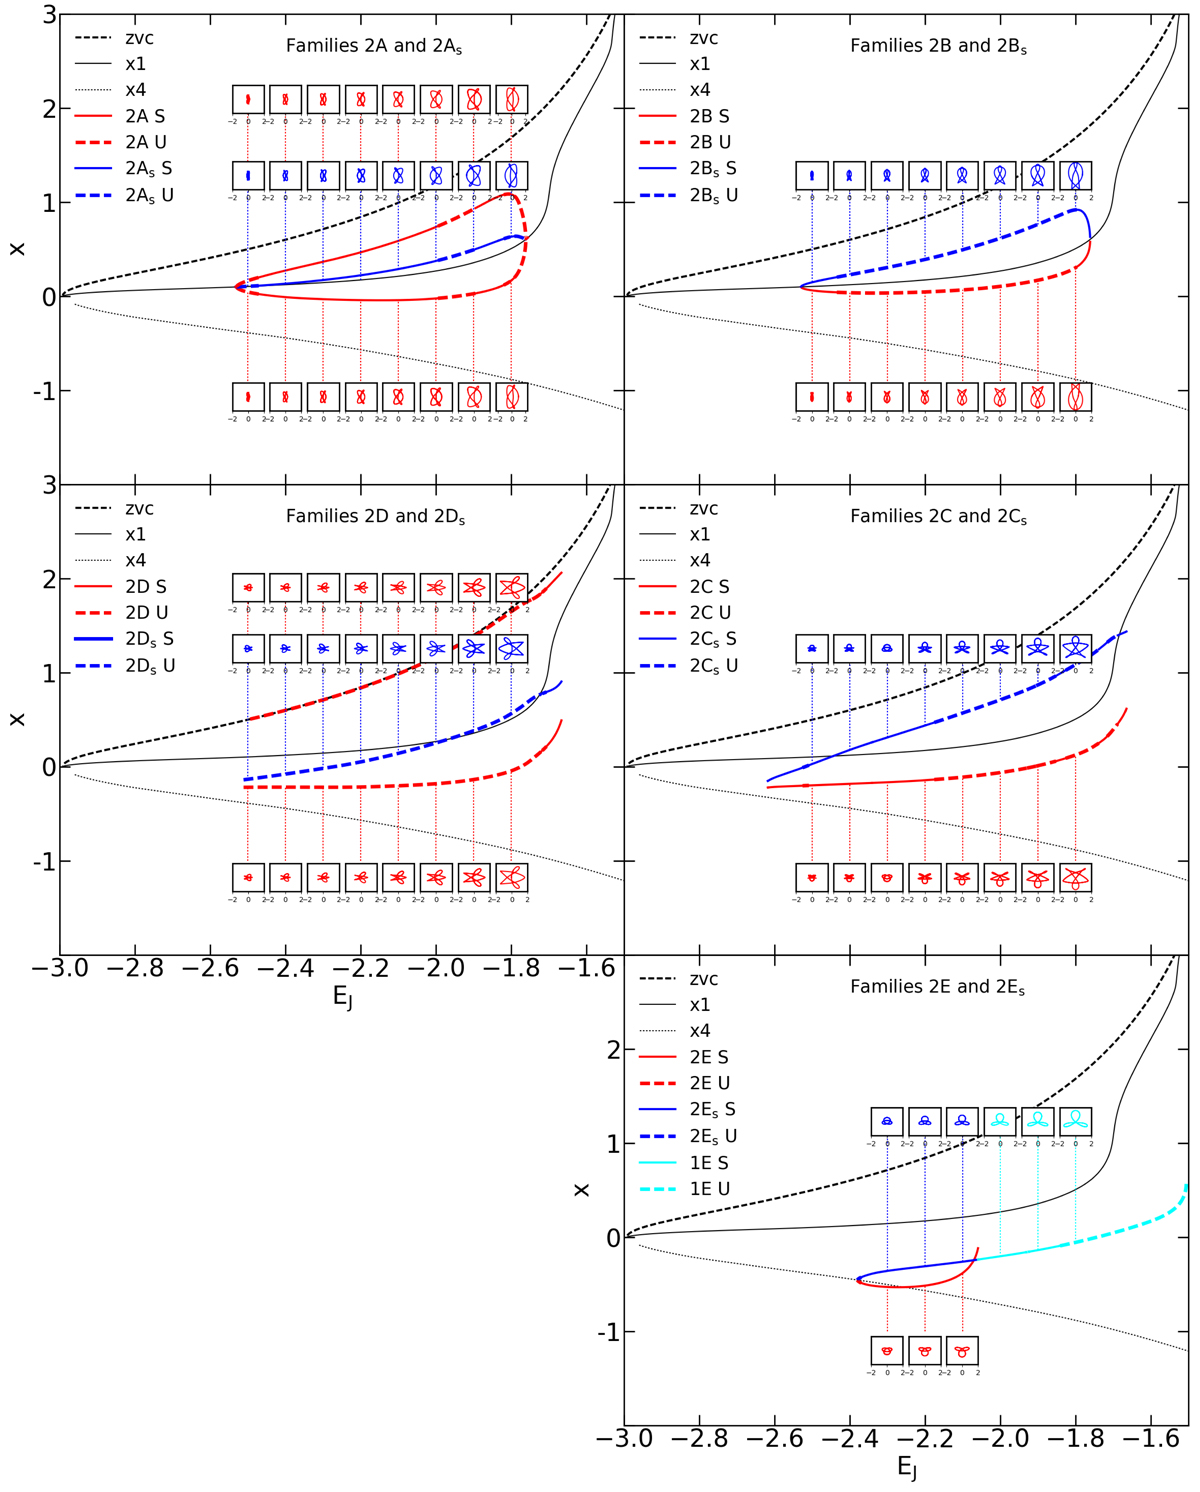
Download original image
Characteristic diagram calculated using the CylSP potential. Each panel gives information on a pair of symmetric families, identified at the top of the panel. Information on the form of the orbits is given in small inserts, as described in Sect. 4.2. We note the name of the various families in the left of the panel. We also distinguish between stable (S on the plot) and unstable orbits (U on the plot), using a full line for the former and a dashed line for the latter. We also plot the zero-velocity curve (thick dashed black line), and the characteristics of the x1 and x4 orbits (thin solid and dotted lines, respectively). The cyan line in the bottom right panel is for the 1E family. More detailed discussions for family 1E can be found in Appendix B.1.
Current usage metrics show cumulative count of Article Views (full-text article views including HTML views, PDF and ePub downloads, according to the available data) and Abstracts Views on Vision4Press platform.
Data correspond to usage on the plateform after 2015. The current usage metrics is available 48-96 hours after online publication and is updated daily on week days.
Initial download of the metrics may take a while.