Open Access
Fig. 4.
Download original image
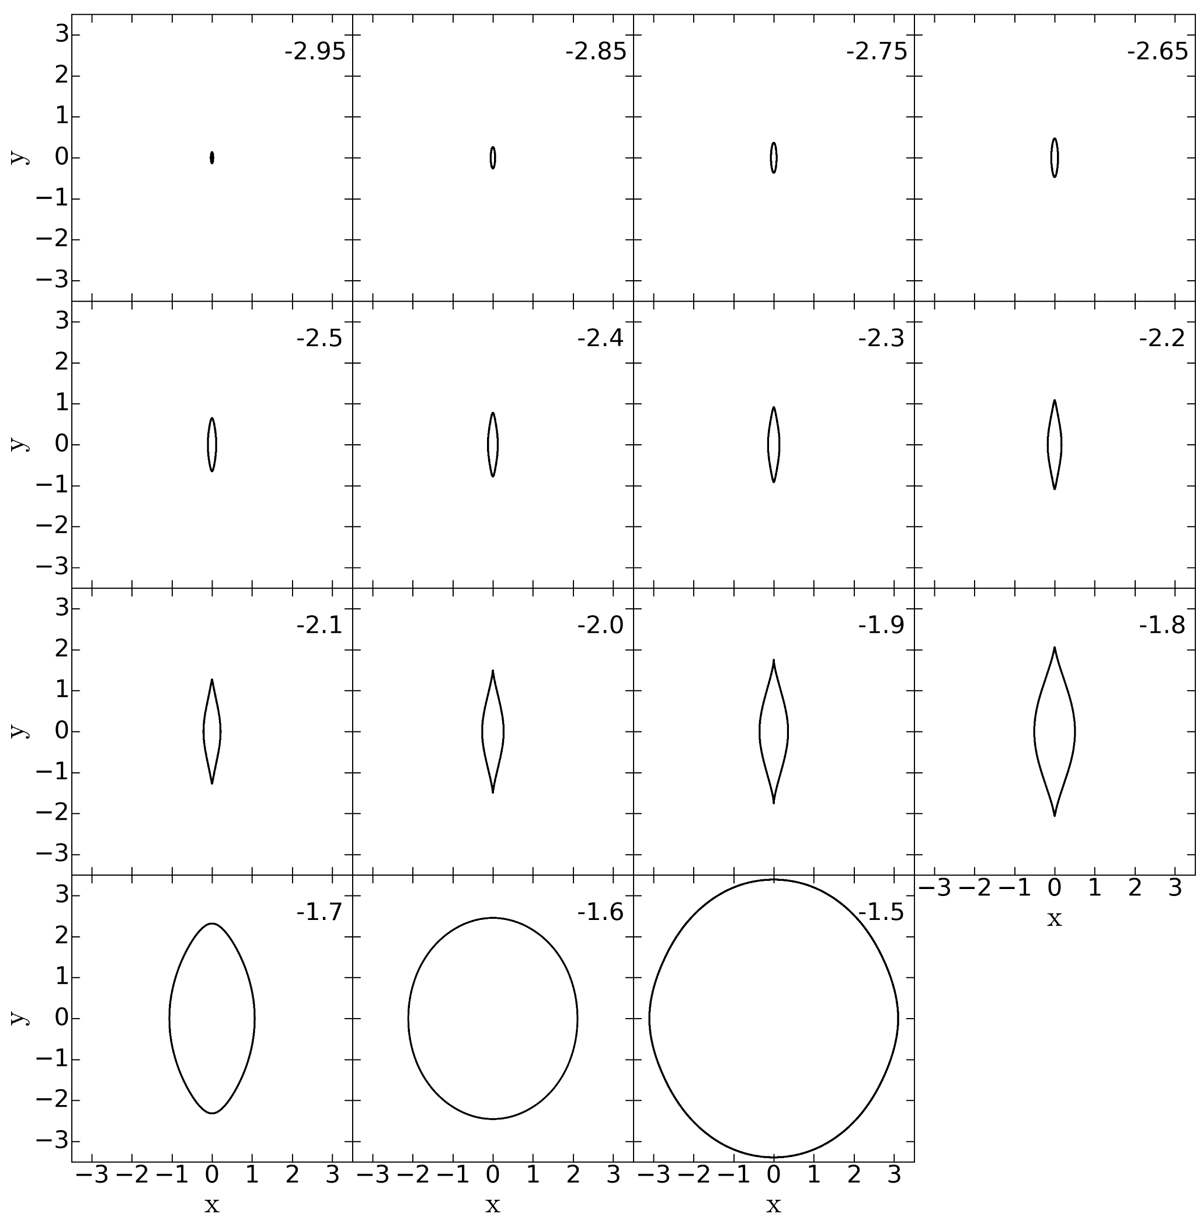
Shape of the x1 POs in our model potential, as a function of the Jacobi constant. The Jacobi constant increases from left to right and from top to bottom. It is given in the upper right corner of each panel. It should be noted that the major axis of the bar is along the y axis.
Current usage metrics show cumulative count of Article Views (full-text article views including HTML views, PDF and ePub downloads, according to the available data) and Abstracts Views on Vision4Press platform.
Data correspond to usage on the plateform after 2015. The current usage metrics is available 48-96 hours after online publication and is updated daily on week days.
Initial download of the metrics may take a while.