Open Access
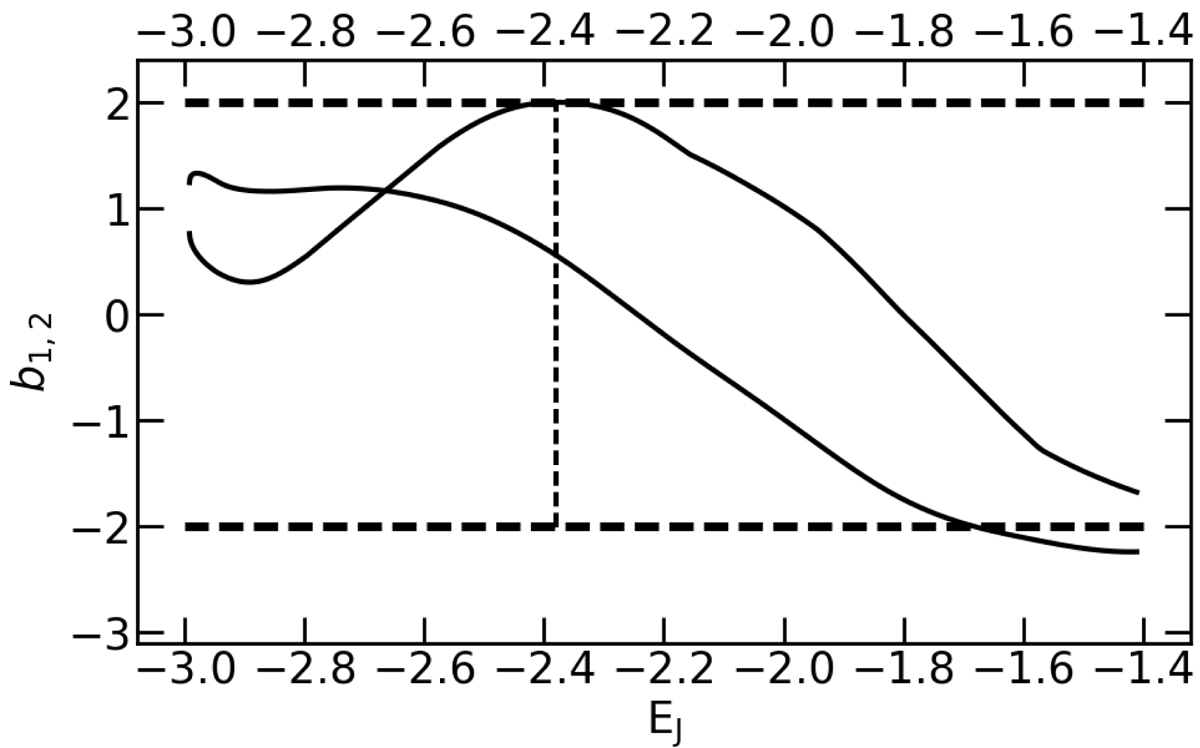
Fig. C.2.
Download original image
Stability diagram for x4 orbits. We plot b1 and b2 as a function of EJ with a solid line and indicate the limits of the stability range by two horizontal dashed lines. The vertical dashed line shows the EJ at which the 2E family bifurcates from the x4 family.
Current usage metrics show cumulative count of Article Views (full-text article views including HTML views, PDF and ePub downloads, according to the available data) and Abstracts Views on Vision4Press platform.
Data correspond to usage on the plateform after 2015. The current usage metrics is available 48-96 hours after online publication and is updated daily on week days.
Initial download of the metrics may take a while.