Fig. B.1.
Download original image
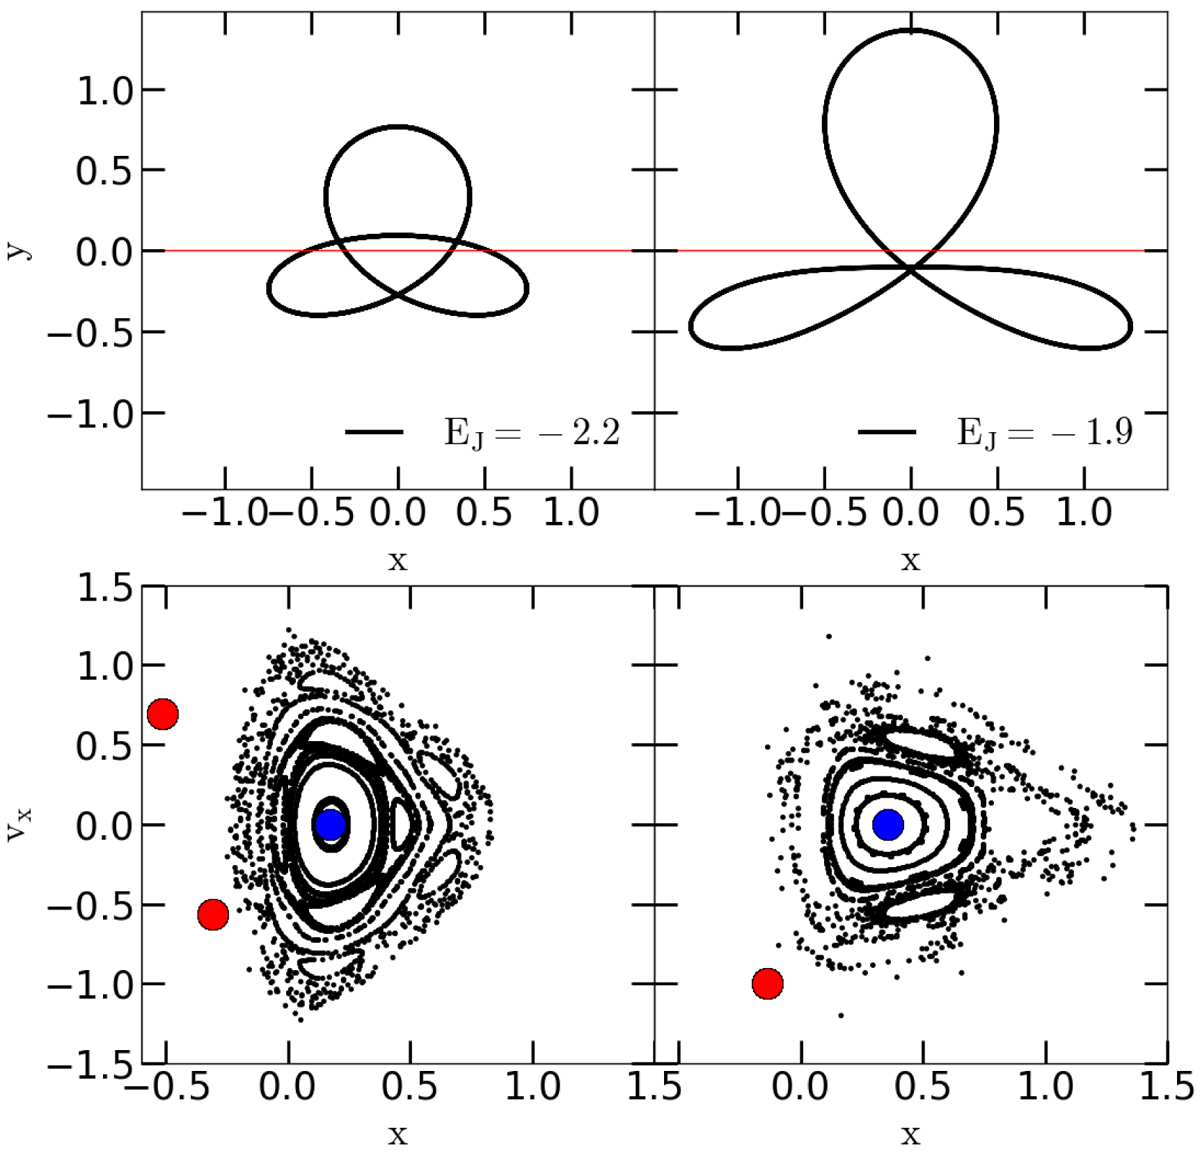
Change in multiplicity along the characteristic curve of the 2E family. The top row of panels shows the (x,y) view of two POs whose EJ values are given in the bottom right corner of the corresponding panel. The thin red horizontal lines are just to guide the eye and to show the location of y = 0. The bottom row of panels shows the location of the corresponding invariant points on the SoS. The blue filled circle in each panel corresponds to the x1 invariant point, while the red ones correspond to those of the 2E POs. It should be noted that the orbit to the left has two invariant points, i.e. an ℳ = 2, while the one on the right has a single invariant point, i.e. ℳ = 1. This multiplicity shift occurs at EJ=-2.0591.
Current usage metrics show cumulative count of Article Views (full-text article views including HTML views, PDF and ePub downloads, according to the available data) and Abstracts Views on Vision4Press platform.
Data correspond to usage on the plateform after 2015. The current usage metrics is available 48-96 hours after online publication and is updated daily on week days.
Initial download of the metrics may take a while.