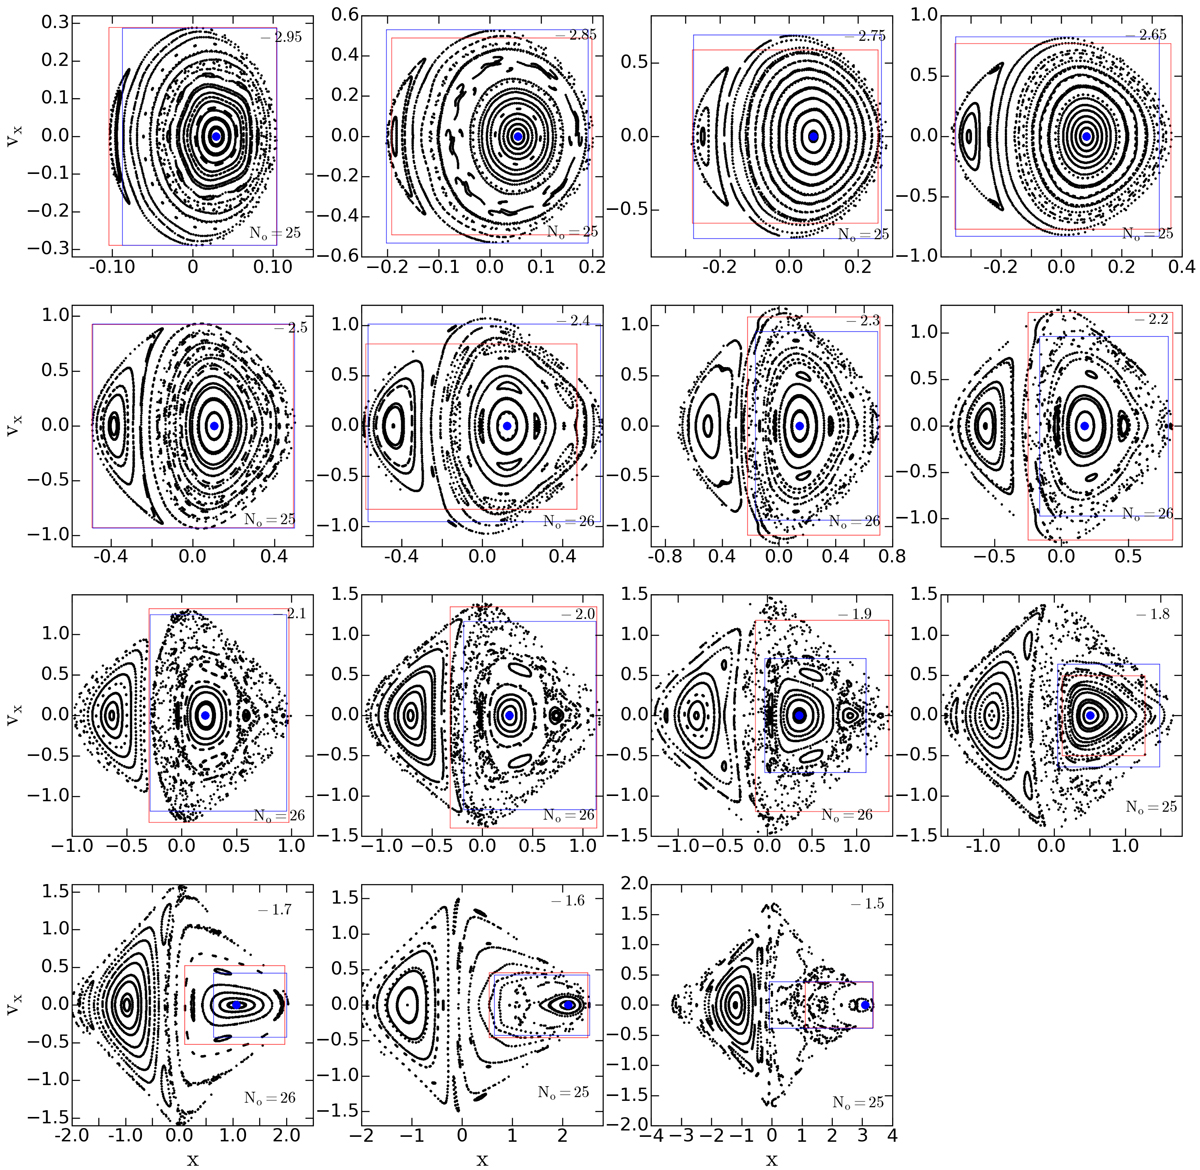
Fig. 1.
Download original image
Surfaces of section in the potential calculated with CylSP and for different Jacobi energies, whose values are given in the upper right corner of each panel. The blue filled circle in each panel denotes the position of the x1 invariant point. The SoS in each panel was obtained by selecting the initial conditions of each orbit on a grid covering the available part of the SoS, i.e. using the standard method. The number of orbits included in a given SoS is shown in the bottom right corner of each panel. The red and blue boxes in each panel indicate the corresponding phase regions in Figs. 2 and 3, respectively.
Current usage metrics show cumulative count of Article Views (full-text article views including HTML views, PDF and ePub downloads, according to the available data) and Abstracts Views on Vision4Press platform.
Data correspond to usage on the plateform after 2015. The current usage metrics is available 48-96 hours after online publication and is updated daily on week days.
Initial download of the metrics may take a while.