Open Access
Fig. 7.
Download original image
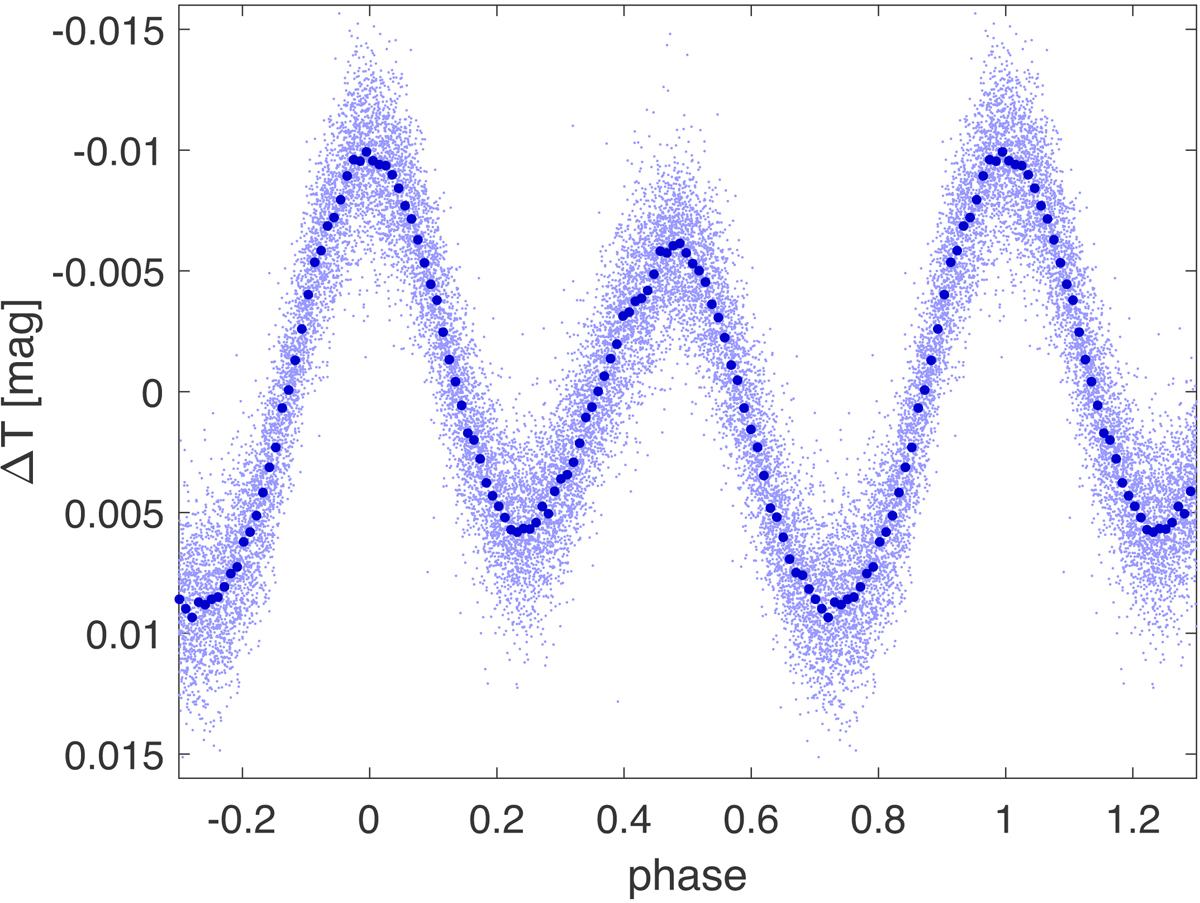
Phased TESS light curve of HD 98000, which clearly shows a double-wave light curve. The small blue dots denote detrended observations; the large blue dots are normal points representing the mean phased light curve (see Appendix B).
Current usage metrics show cumulative count of Article Views (full-text article views including HTML views, PDF and ePub downloads, according to the available data) and Abstracts Views on Vision4Press platform.
Data correspond to usage on the plateform after 2015. The current usage metrics is available 48-96 hours after online publication and is updated daily on week days.
Initial download of the metrics may take a while.