Open Access
Fig. 6.
Download original image
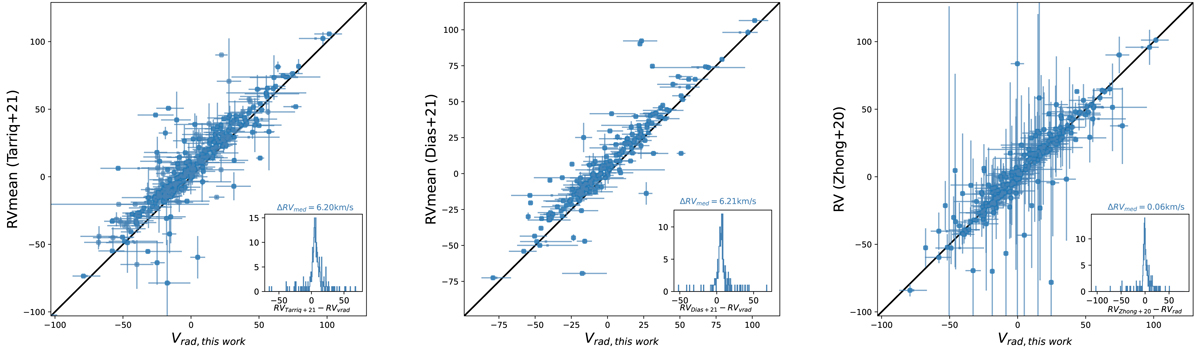
Comparison of our cluster Vrad to results in the literature. Left, middle, and right panels: comparison to 308, 185, and 226 OCs of Tarricq et al. (2021), Dias et al. (2021), and Zhong et al. (2020), respectively. The histograms of the cluster RV differences are shown as insets in each panel.
Current usage metrics show cumulative count of Article Views (full-text article views including HTML views, PDF and ePub downloads, according to the available data) and Abstracts Views on Vision4Press platform.
Data correspond to usage on the plateform after 2015. The current usage metrics is available 48-96 hours after online publication and is updated daily on week days.
Initial download of the metrics may take a while.