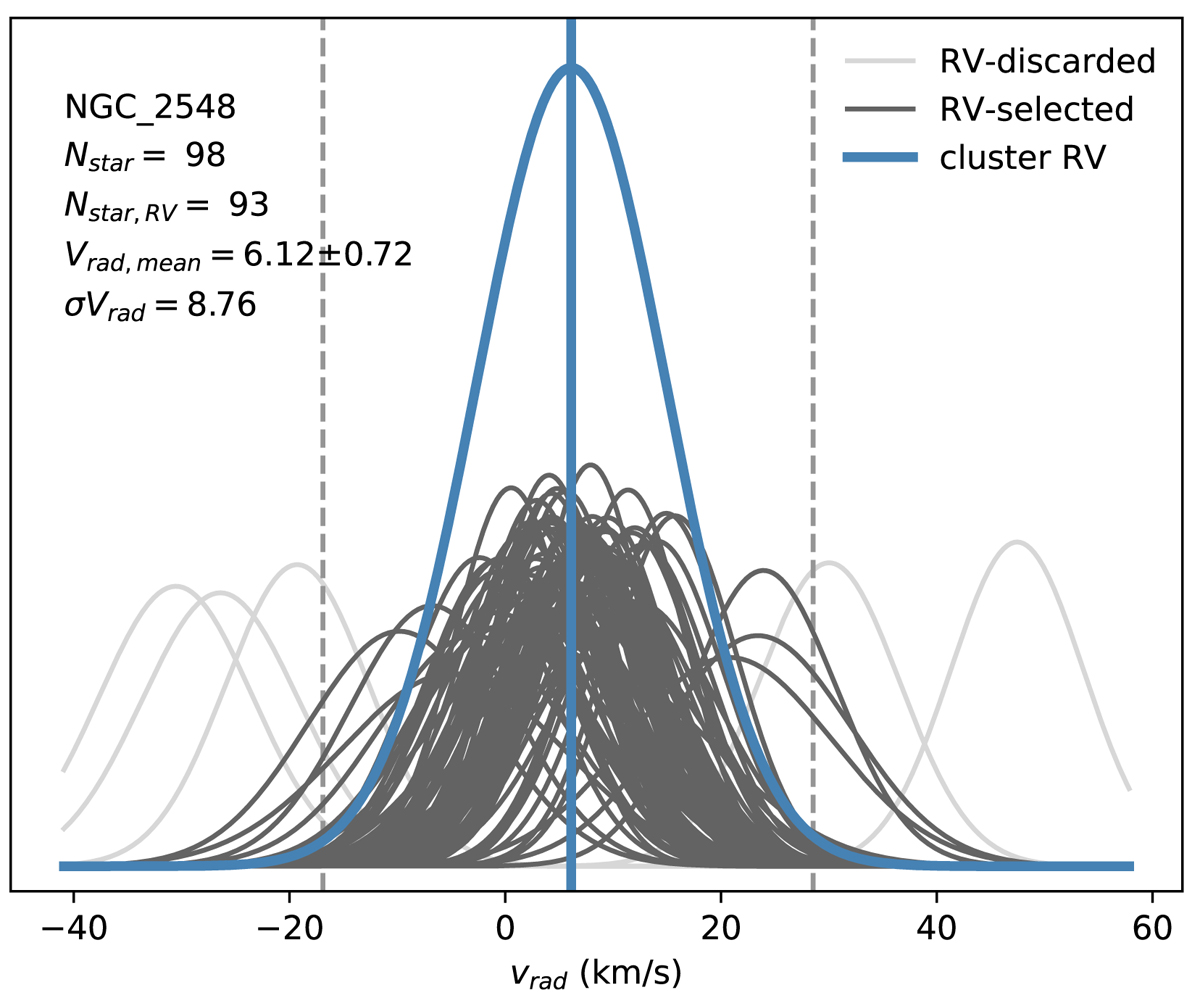
Fig. 2.
Download original image
NGC 2548 as an example of the RV selection. The RVs of all the crossed-matched member stars in the cluster are plotted assuming a normal distribution. The light grey colour curves denote stars we discarded for further analysis (FLAG = 0), while the dark grey ones are the selected stars. The two vertical dashed lines mark the 2-σ selection criterion. The Monte Carlo model result of all the selected stars is illustrated with the blue Gaussian curve. Their mean RV value (Vrad, mean), the 1-σ RV dispersion (σVrad), as well as the number of member stars before (Nstar) and after the RV selection (Nstar, RV), are shown in the legend.
Current usage metrics show cumulative count of Article Views (full-text article views including HTML views, PDF and ePub downloads, according to the available data) and Abstracts Views on Vision4Press platform.
Data correspond to usage on the plateform after 2015. The current usage metrics is available 48-96 hours after online publication and is updated daily on week days.
Initial download of the metrics may take a while.