Open Access
Fig. 4
Download original image
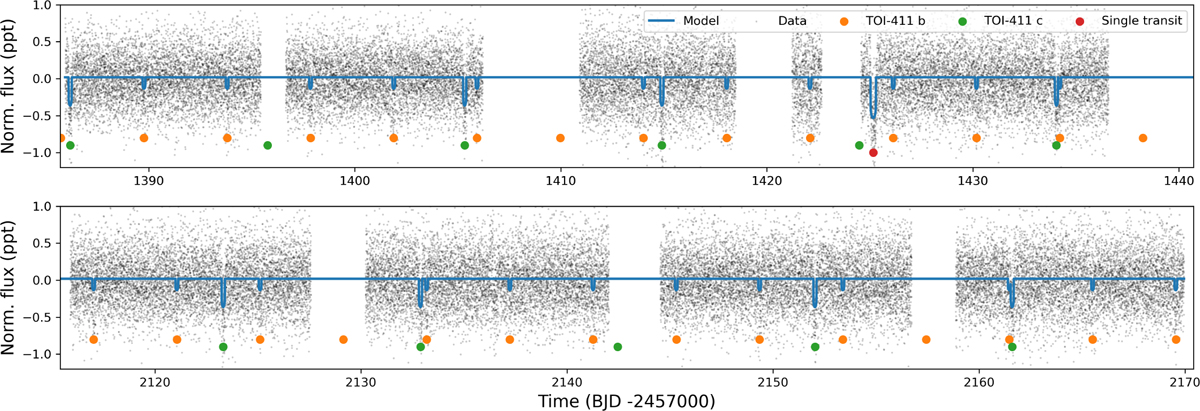
Full light curve of TESS sectors 3, 4 (top panel), 30, and 31 (bottom panel). The blue line is the best-fit model. The transits of planets b and c are highlighted with orange and green dots, respectively. The single transit event is highlighted with a red dot.
Current usage metrics show cumulative count of Article Views (full-text article views including HTML views, PDF and ePub downloads, according to the available data) and Abstracts Views on Vision4Press platform.
Data correspond to usage on the plateform after 2015. The current usage metrics is available 48-96 hours after online publication and is updated daily on week days.
Initial download of the metrics may take a while.