Fig. 2
Download original image
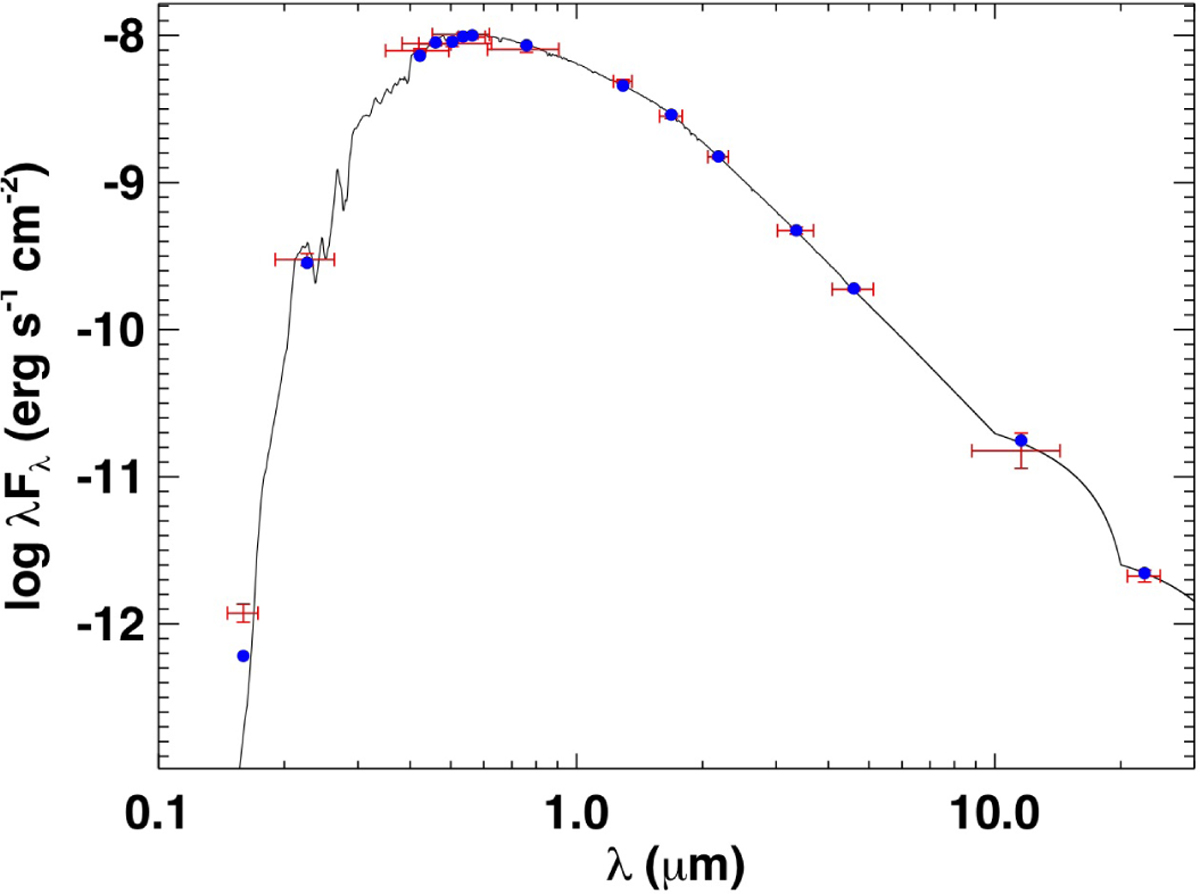
Spectral energy distribution of HD 22946. The blue symbols and their vertical error bars represent the photometric measurements available for this source and listed in Table 1. The horizontal bars indicate instead the width of the passband for each data point. The overplotted black line is the best-fit model, which allows us to derive the stellar parameters.
Current usage metrics show cumulative count of Article Views (full-text article views including HTML views, PDF and ePub downloads, according to the available data) and Abstracts Views on Vision4Press platform.
Data correspond to usage on the plateform after 2015. The current usage metrics is available 48-96 hours after online publication and is updated daily on week days.
Initial download of the metrics may take a while.