Fig. 1
Download original image
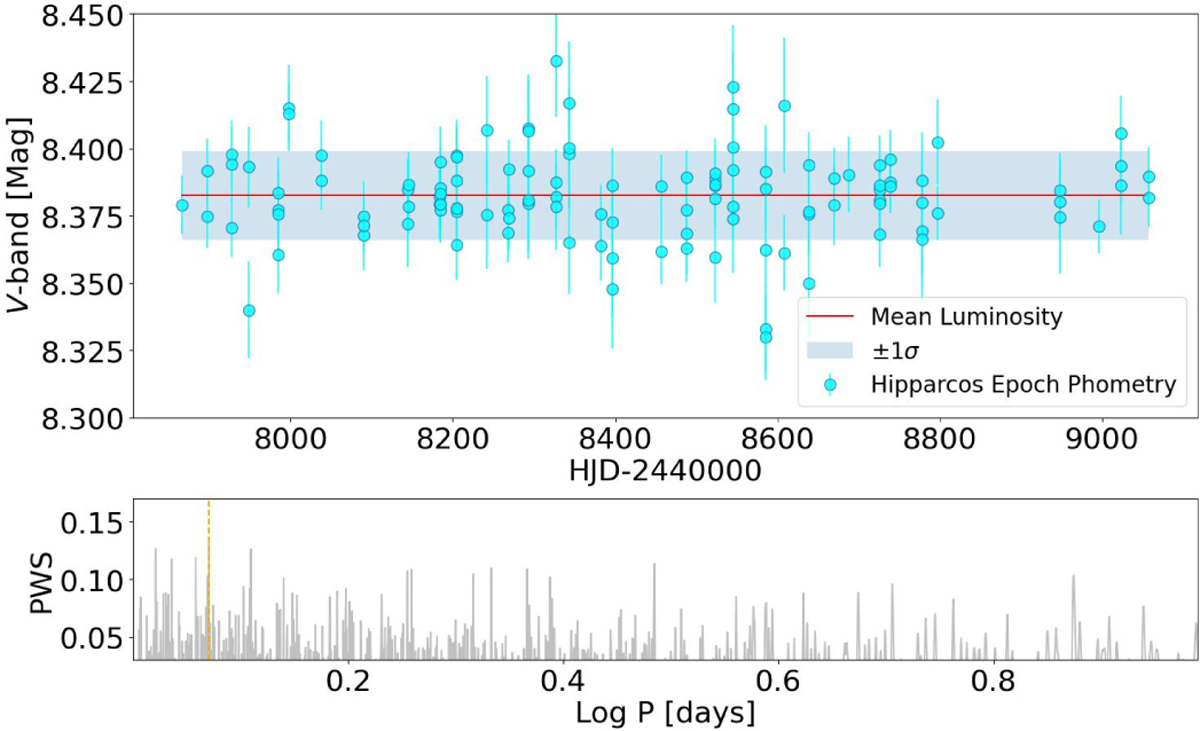
Light curve of HD 22946 from the Hipparcos Epoch Photometry data (V-band, top panel), and the corresponding power spectrum (bottom panel). In the top panel, the mean luminosity and standard deviation are also shown: the scatter in the photometric data is compatible with a low-amplitude variability. The peak of the power spectrum, indicated by the orange vertical line, is found at ≈0.073 days, and it is likely due to instrumental aliasing.
Current usage metrics show cumulative count of Article Views (full-text article views including HTML views, PDF and ePub downloads, according to the available data) and Abstracts Views on Vision4Press platform.
Data correspond to usage on the plateform after 2015. The current usage metrics is available 48-96 hours after online publication and is updated daily on week days.
Initial download of the metrics may take a while.