Open Access
Fig. 8.
Download original image
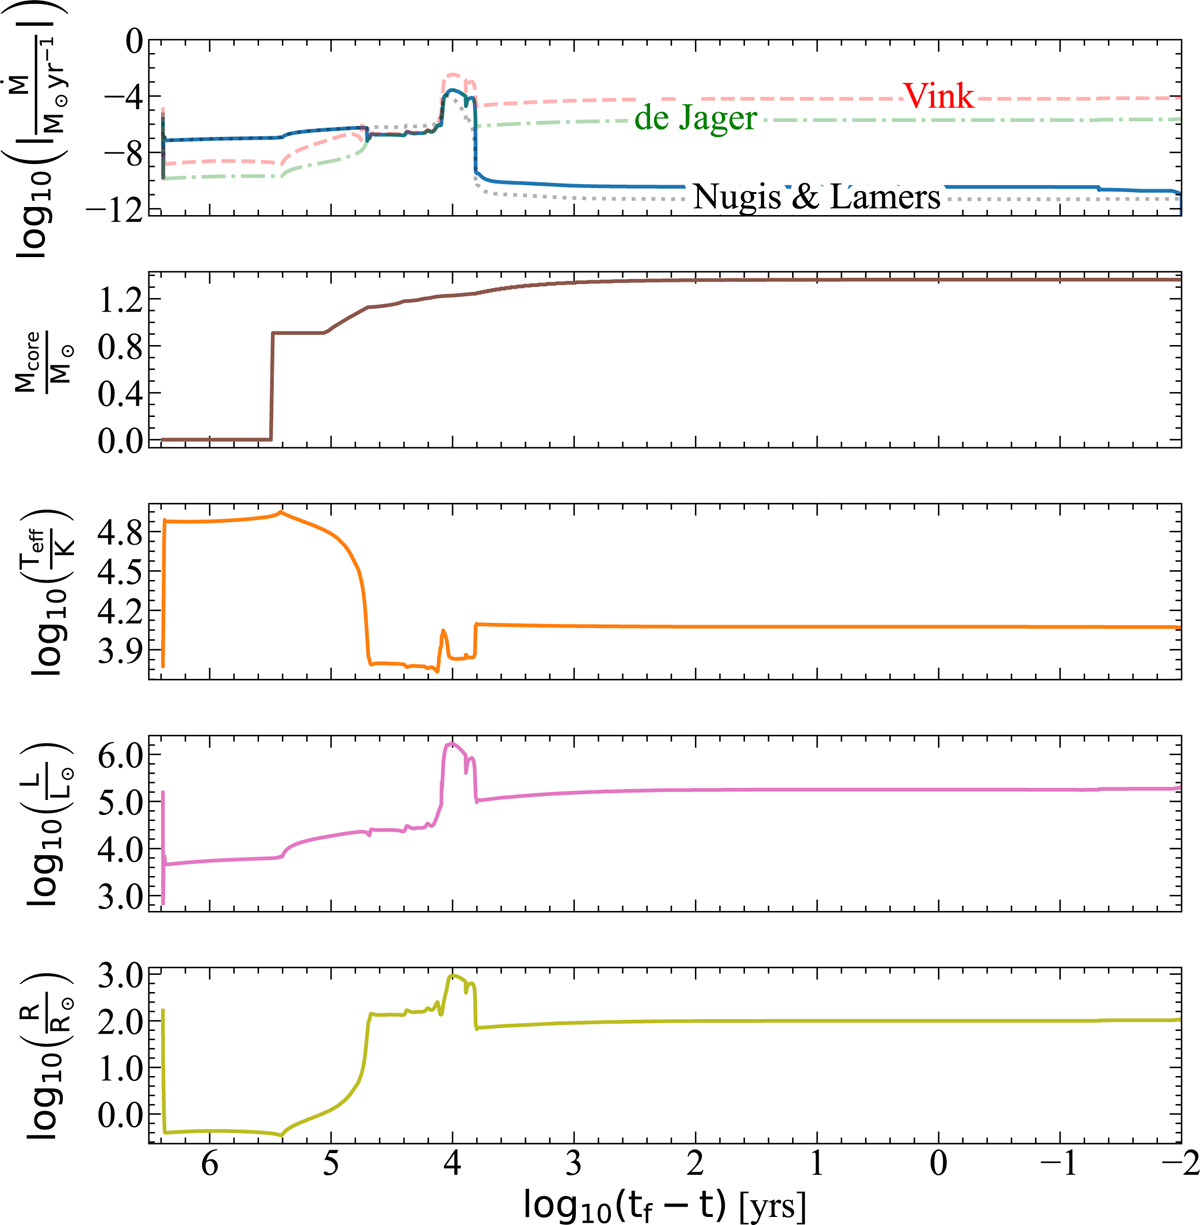
Mass loss rate, core mass growth, Teff, luminosity, and radius vs remaining time for the 2.5 M⊙ fiducial model of SERIES I. The translucent dashed, dotted, and dash-dotted lines represent the mass loss rates based on Vink (2017), Nugis & Lamers (2000), and de Jager et al. (1988) respectively.
Current usage metrics show cumulative count of Article Views (full-text article views including HTML views, PDF and ePub downloads, according to the available data) and Abstracts Views on Vision4Press platform.
Data correspond to usage on the plateform after 2015. The current usage metrics is available 48-96 hours after online publication and is updated daily on week days.
Initial download of the metrics may take a while.