Fig. 7.
Download original image
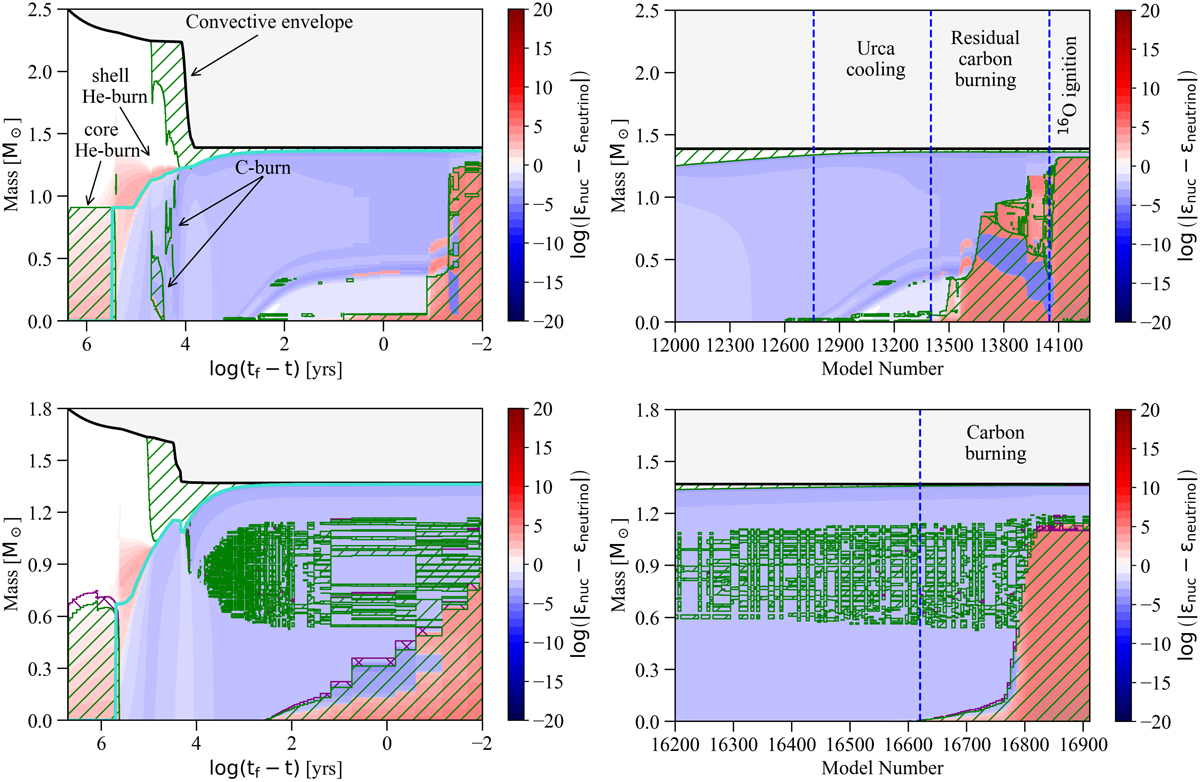
On the left, we present a Kippenhahn diagram of two SERIES I stellar models as a function of remaining evolution time. On the right, we present a section of the same diagrams but as a function of model number in which the location of some important stages can be seen more accurately. Green hatched areas denote regions of convection. The intensity shown in the colorbar, indicates the net energy rate. Turquoise line shows the CO core. Top panel: structure of a 2.5 M⊙ helium star with Z = 0.02 and no overshooting. During e-captures on 24Mg and subsequent carbon burning, the core becomes convective. Bottom panel: structure of a hybrid 1.8 M⊙ helium star with Z = 0.02 and fOV = 0.014. Convective overshooting (purple hatched area) leads to larger core during the helium main sequence phase. Compressional heating ignites the carbon resulting in a thermal runaway.
Current usage metrics show cumulative count of Article Views (full-text article views including HTML views, PDF and ePub downloads, according to the available data) and Abstracts Views on Vision4Press platform.
Data correspond to usage on the plateform after 2015. The current usage metrics is available 48-96 hours after online publication and is updated daily on week days.
Initial download of the metrics may take a while.