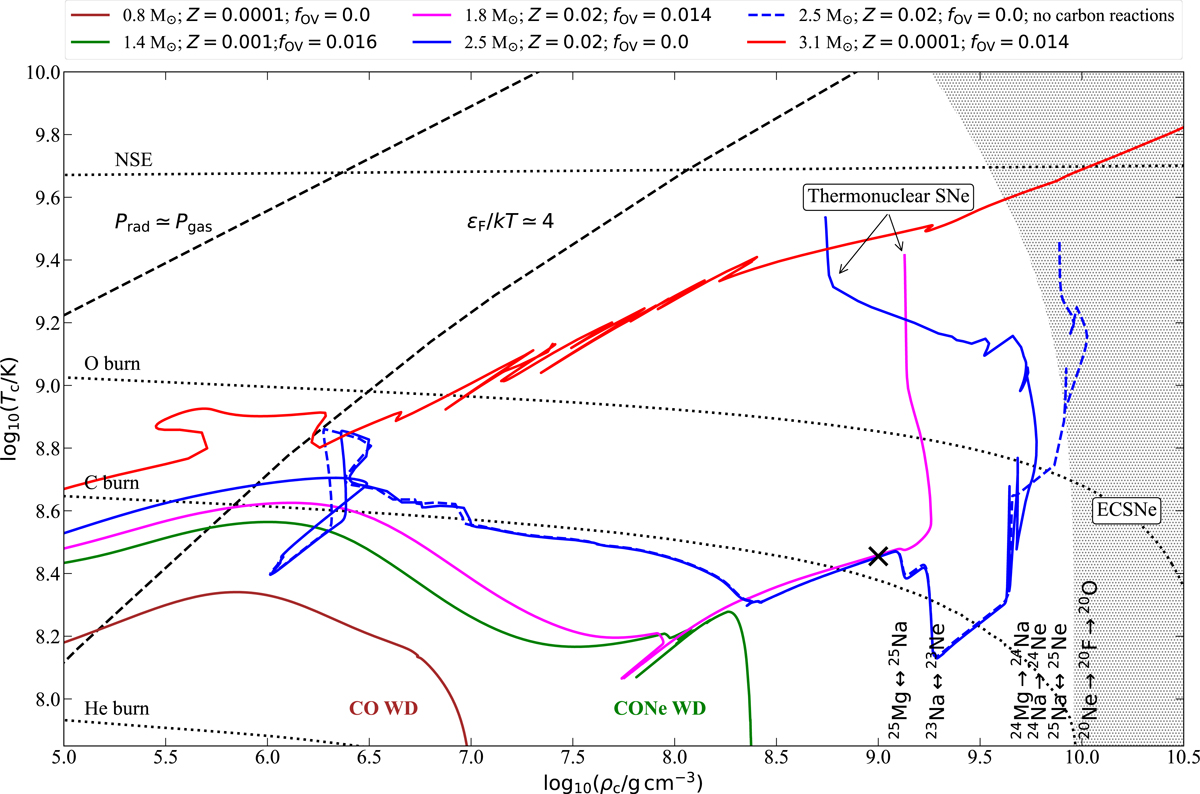
Fig. 3.

Download original image
Examples of the evolution of five SERIES I models with different initial masses in the log(ρc)−log(Tc) plane. Black dotted lines show approximate ignition curves taken from MESA. Black dashed lines indicate different pressure regimes while the hatched area shows the approximate region for e-captures on 20Ne nuclei. The blue dashed line refers to the same stellar model as the one with the solid blue line; the only difference is that for the former, all carbon-participating reaction have been switched off prior to Urca cooling leading most likely to an ECSN. The density at which carbon reactions were turned off is marked by a black cross-mark.
Current usage metrics show cumulative count of Article Views (full-text article views including HTML views, PDF and ePub downloads, according to the available data) and Abstracts Views on Vision4Press platform.
Data correspond to usage on the plateform after 2015. The current usage metrics is available 48-96 hours after online publication and is updated daily on week days.
Initial download of the metrics may take a while.


