Fig. A.4.
Download original image
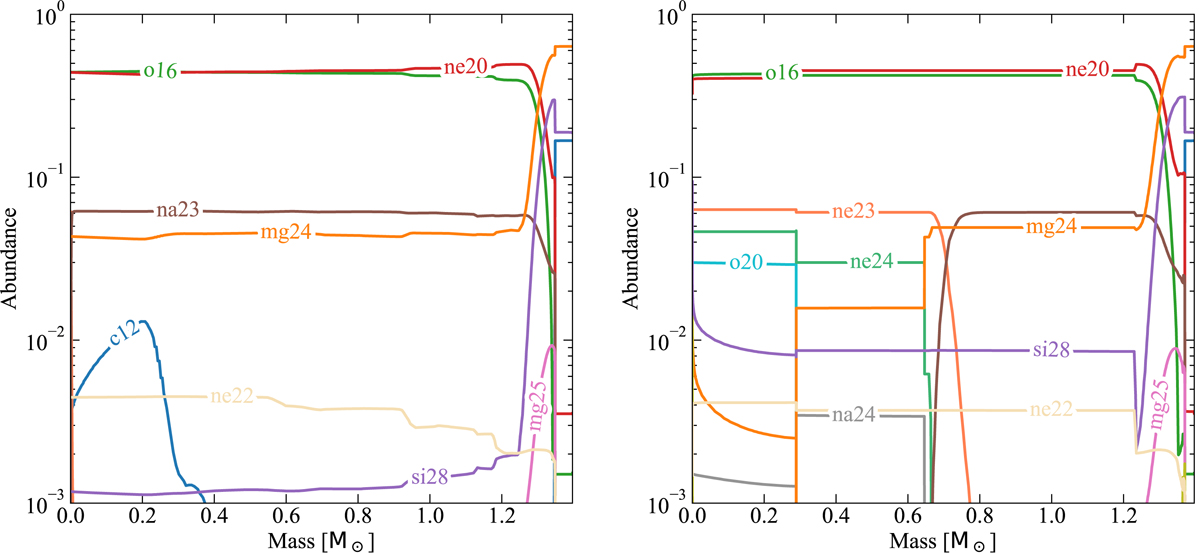
Abundance profiles of the SERIES II 2.7 M⊙, Z = 0.02; fOV = 0.0; η = 0.8 stellar model. The left panel refers to the structure when log(ρc/g cm−3)≃9.0 (shortly before the Urca cooling phase). The right panel shows the final chemical composition of the model after the ignition of neon. This model has reached the critical density for e-captures on 20Ne which leads to the formation of 20O (cyan line).
Current usage metrics show cumulative count of Article Views (full-text article views including HTML views, PDF and ePub downloads, according to the available data) and Abstracts Views on Vision4Press platform.
Data correspond to usage on the plateform after 2015. The current usage metrics is available 48-96 hours after online publication and is updated daily on week days.
Initial download of the metrics may take a while.