Fig. A.2.
Download original image
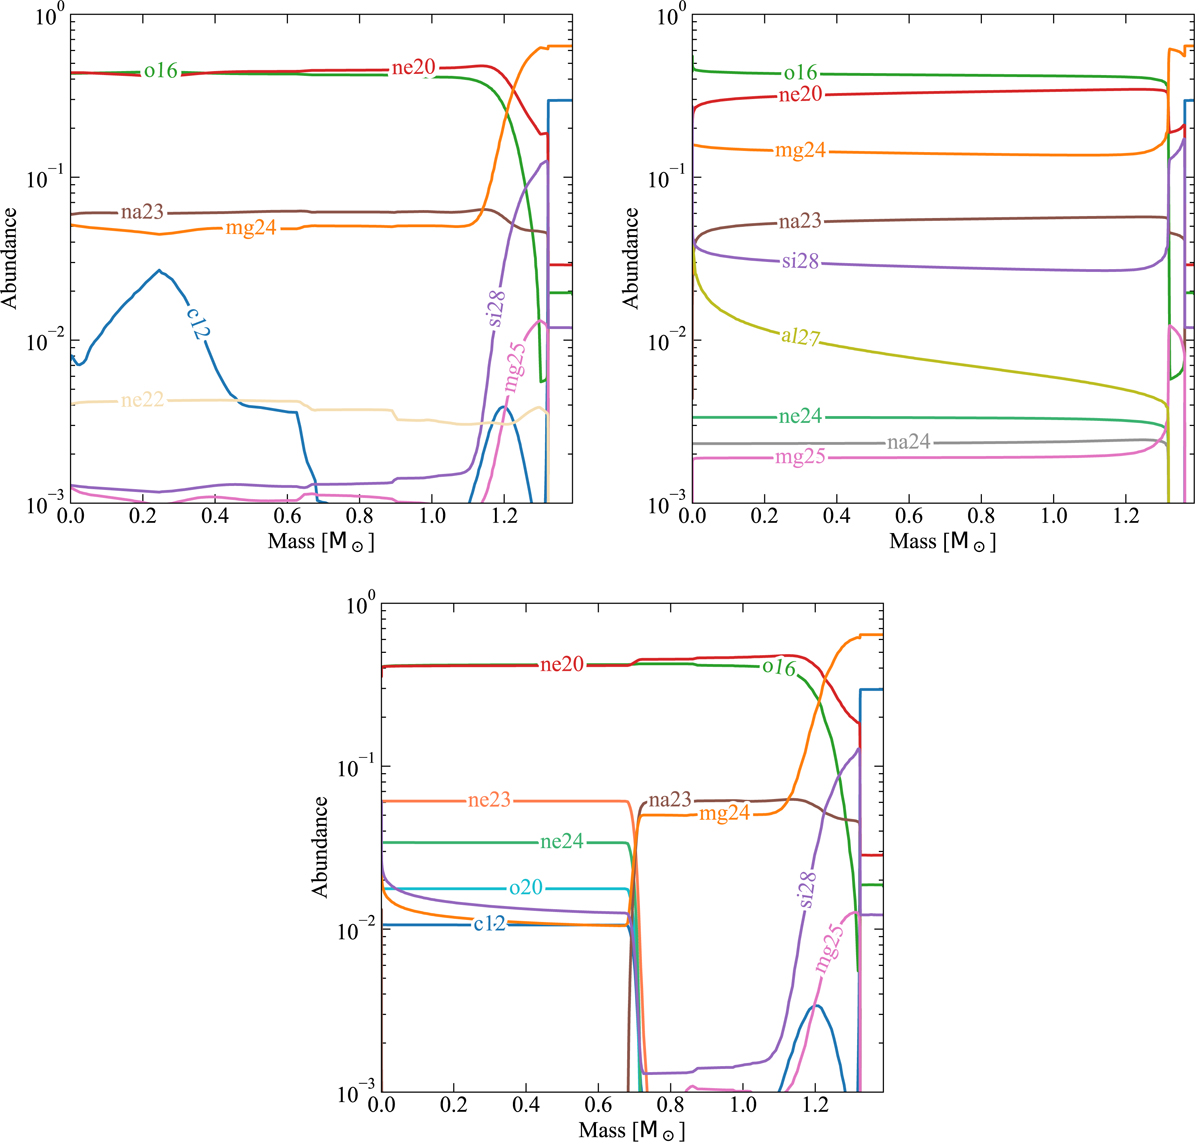
Abundance profiles of the SERIES I 2.5 M⊙, Z = 0.02; fOV = 0.0 stellar model. The top-left panel refers to the structure when log(ρc/g cm−3)≃9.0. The distribution of residual carbon from previous burning stages is visible. The top-right panel shows the final composition of this model. Ignition of residual carbon leads to thermonuclear explosion. The panel at the bottom shows the final structure of the same model, in the case where carbon-consuming nuclear reactions have been turned off. In this scenario, the core reaches the density threshold for e-captures on Ne nuclei to commence, leading to formation of 20O, and most likely to an ECSN.
Current usage metrics show cumulative count of Article Views (full-text article views including HTML views, PDF and ePub downloads, according to the available data) and Abstracts Views on Vision4Press platform.
Data correspond to usage on the plateform after 2015. The current usage metrics is available 48-96 hours after online publication and is updated daily on week days.
Initial download of the metrics may take a while.