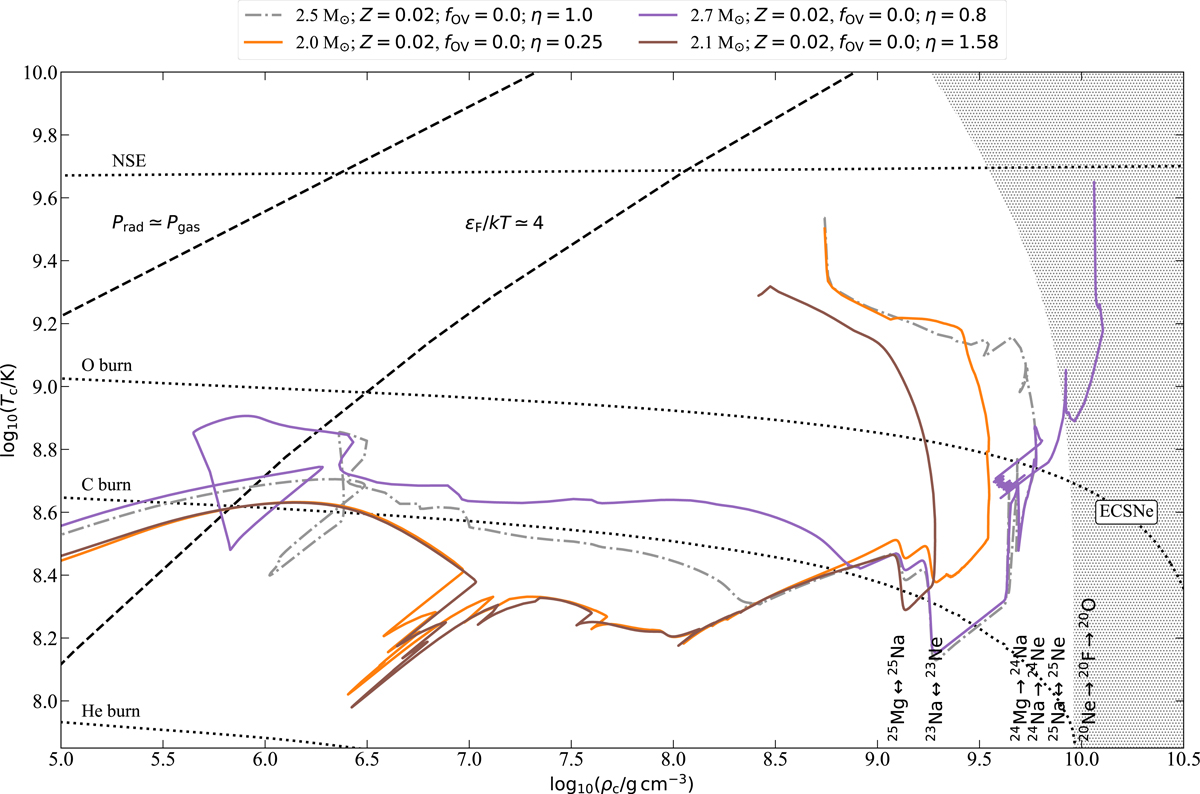
Fig. 14.

Download original image
Evolution of central temperature vs central density for three SERIES II models with different wind efficiencies. Black-dotted lines show approximate ignition thresholds taken from MESA. Black dashed lines indicate different pressure regimes while the hatched area shows the approximate region for e-captures on 20Ne nuclei. An inefficient Urca cooling phase can leave the core with an excess amount of heat igniting the residual carbon before the e-captures on 24Mg (orange and brown curves). The grey dash-dotted line shows the–efficient–cooling and subsequent adiabatic evolution of our SERIES I fiducial model, which leads to a thermal runaway caused by the e-captures on 24Mg. The model depicted here with purple color ignites oxygen at high densities leading, most likely, to an ECSN.
Current usage metrics show cumulative count of Article Views (full-text article views including HTML views, PDF and ePub downloads, according to the available data) and Abstracts Views on Vision4Press platform.
Data correspond to usage on the plateform after 2015. The current usage metrics is available 48-96 hours after online publication and is updated daily on week days.
Initial download of the metrics may take a while.


