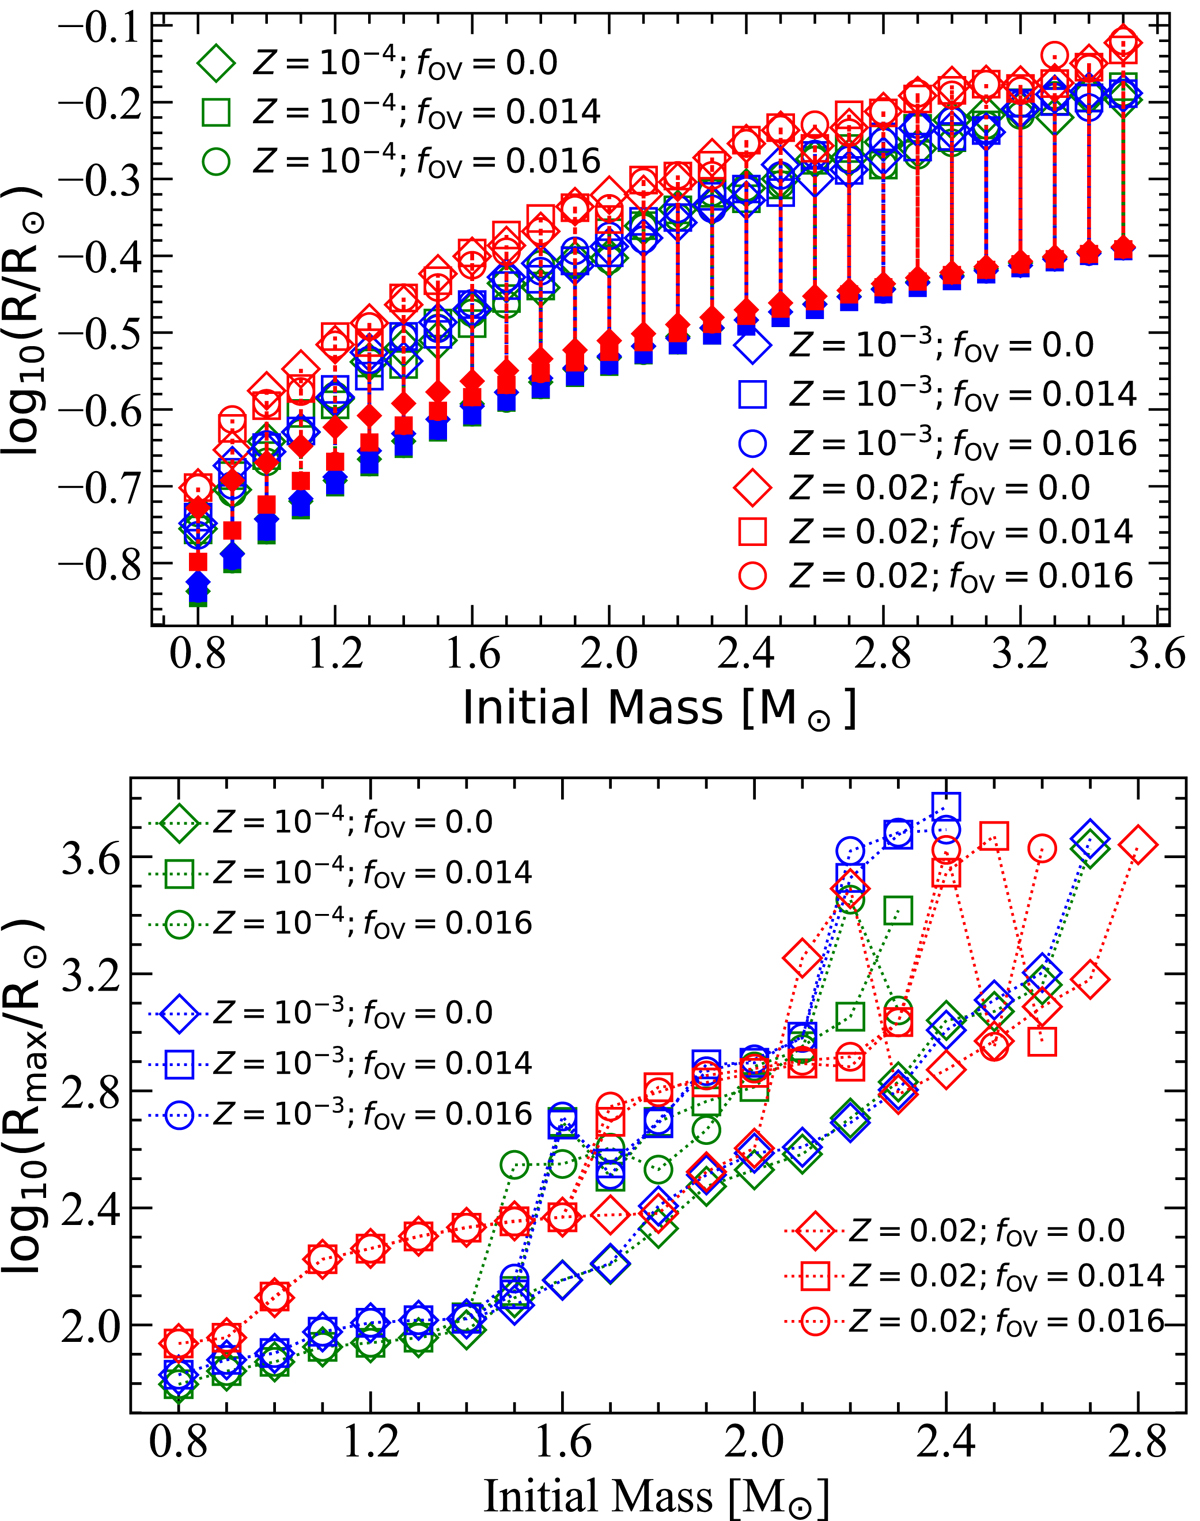
Fig. 10.
Download original image
Radius as a function of initial mass for our SERIES I models. The upper panel shows the evolution of the radius during helium main sequence phase. The commencement and finish of core helium burning are shown by nonfilled and filled data points, respectively. The maximum radius reached is depicted in the lower panel. These radii might be underestimated since MLT++ suppresses envelope inflation (see Sect. 4.4).
Current usage metrics show cumulative count of Article Views (full-text article views including HTML views, PDF and ePub downloads, according to the available data) and Abstracts Views on Vision4Press platform.
Data correspond to usage on the plateform after 2015. The current usage metrics is available 48-96 hours after online publication and is updated daily on week days.
Initial download of the metrics may take a while.