Fig. 3
Download original image
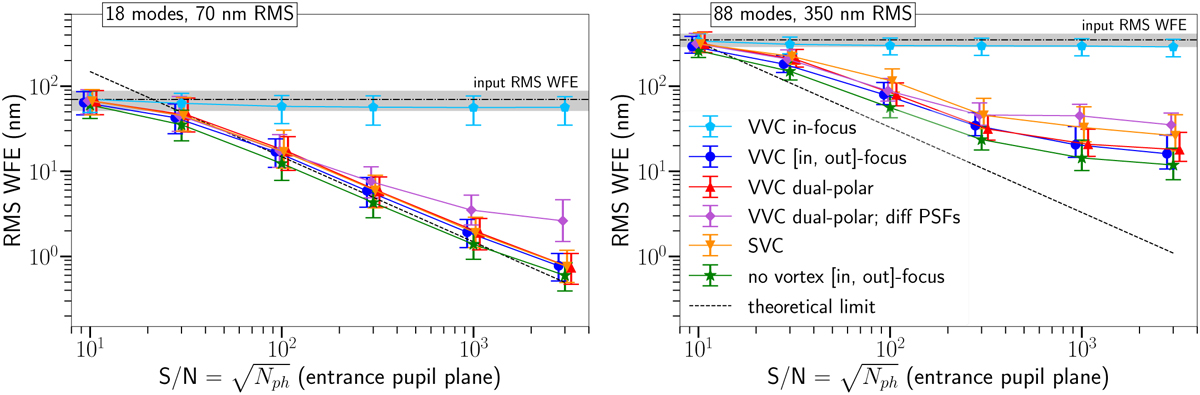
Performance in terms of RMS WFE on the phase residuals at different S/N levels. Each point corresponds to a model trained and evaluated on the indicated S/N (six S/Ns are considered, and slight horizontal shifts were applied to be able to discern each point). The same colors in Fig. 2 are used, with the addition of the performance with classical imaging (green), using differential post-VVC PSFs (violet), as well as the theoretical limit (black dashed line). The median values are represented and the error bars correspond to the 2–98th percentiles. The S/Ns indicated are the ones at the entrance pupil plane, and the flux suppression induced by the vortex mask is taken into account. Left: input WFE of 70 nm distributed over 18 modes. Right: input WFE of 350 nm distributed over 88 modes.
Current usage metrics show cumulative count of Article Views (full-text article views including HTML views, PDF and ePub downloads, according to the available data) and Abstracts Views on Vision4Press platform.
Data correspond to usage on the plateform after 2015. The current usage metrics is available 48-96 hours after online publication and is updated daily on week days.
Initial download of the metrics may take a while.