Fig. 9.
Download original image
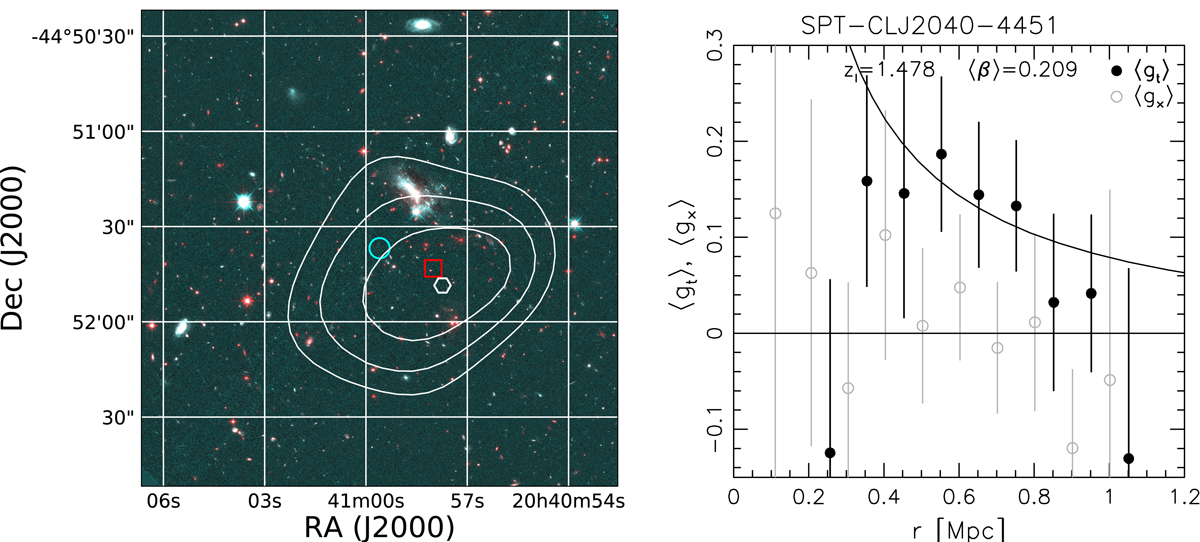
Weak lensing results for SPT-CL J2040−4451. Left: signal-to-noise ratio contours of the mass reconstruction, starting at 2σ in steps of 0.5σ, overlaid on a F606W/F814W/F110W colour image (![]() cutout). The peak in the S/N map is indicated by the hexagon (excluding potential spurious secondary peaks near the edge of the field of view). The cyan circle and the red square show the locations of the SZ peak and the X-ray centroid, respectively. Right: reduced shear profile around the X-ray centre, including the tangential component (solid black circles including the best-fitting NFW model) and the cross component (open grey circles), which has been shifted along the x-axis for clarity. The results for the other clusters are shown in Appendix G.
cutout). The peak in the S/N map is indicated by the hexagon (excluding potential spurious secondary peaks near the edge of the field of view). The cyan circle and the red square show the locations of the SZ peak and the X-ray centroid, respectively. Right: reduced shear profile around the X-ray centre, including the tangential component (solid black circles including the best-fitting NFW model) and the cross component (open grey circles), which has been shifted along the x-axis for clarity. The results for the other clusters are shown in Appendix G.
Current usage metrics show cumulative count of Article Views (full-text article views including HTML views, PDF and ePub downloads, according to the available data) and Abstracts Views on Vision4Press platform.
Data correspond to usage on the plateform after 2015. The current usage metrics is available 48-96 hours after online publication and is updated daily on week days.
Initial download of the metrics may take a while.