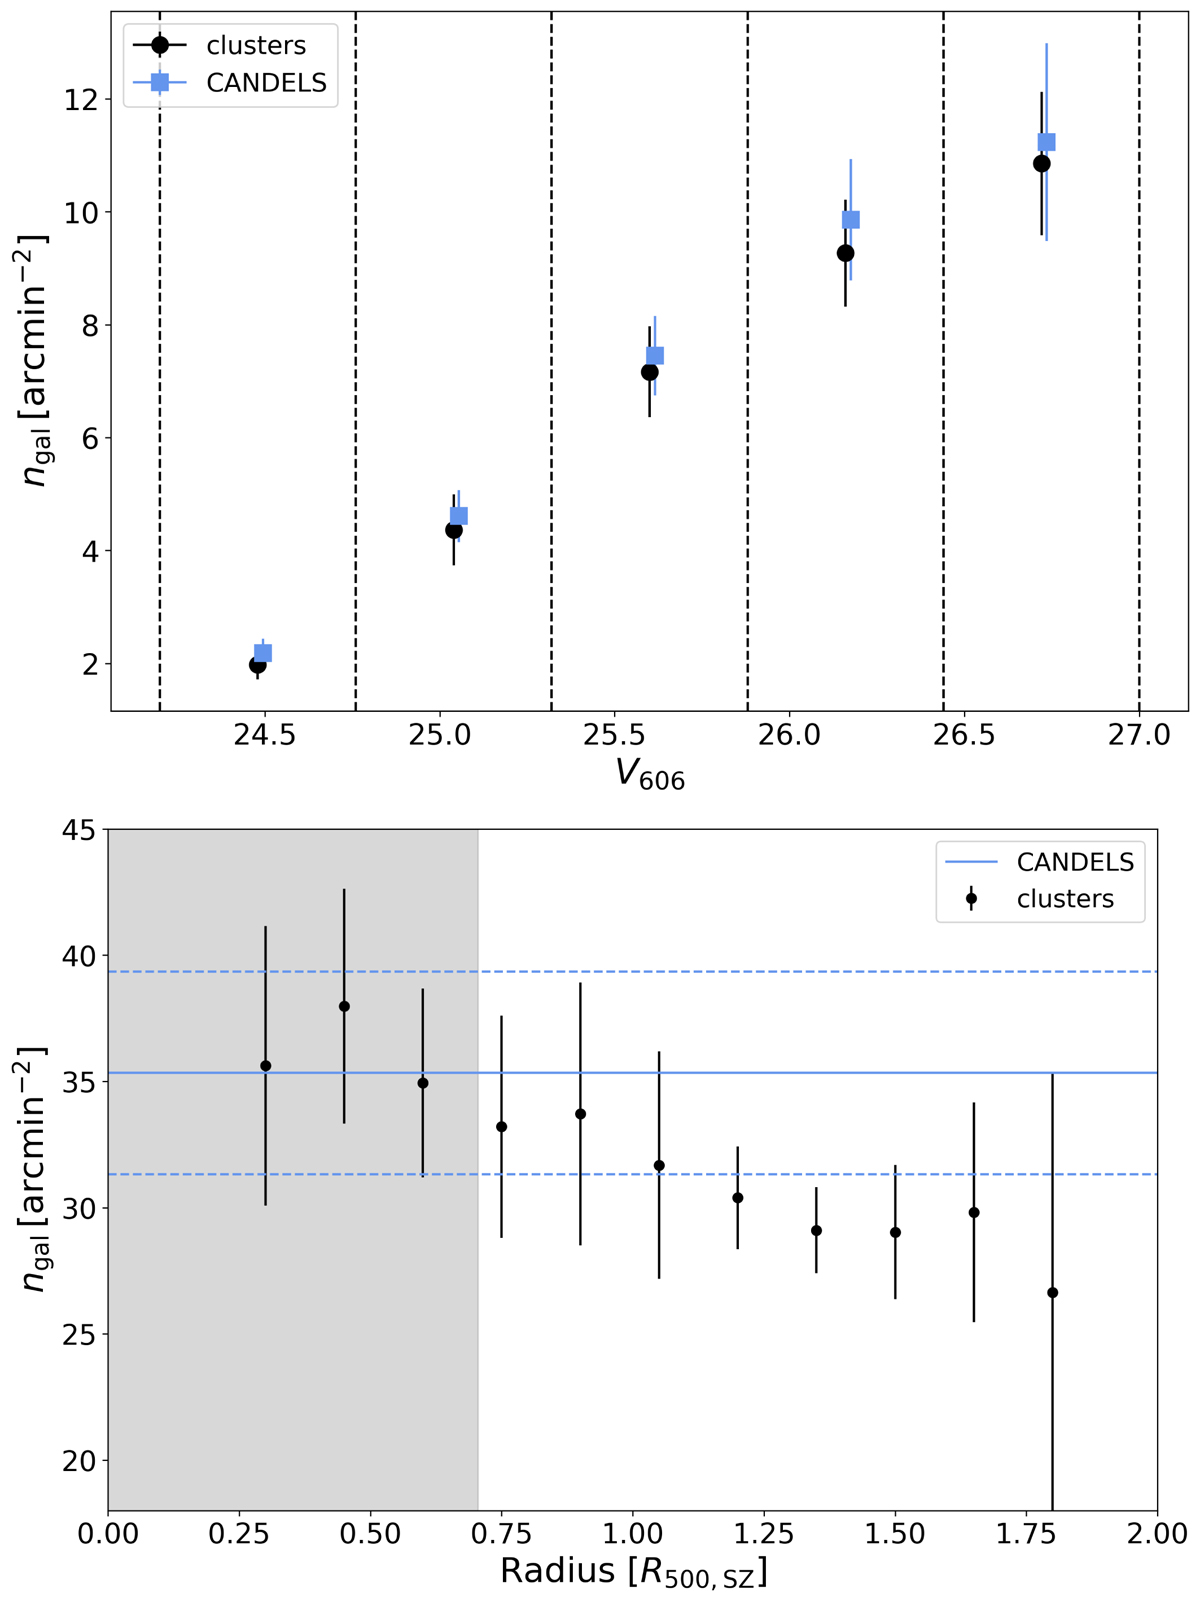
Fig. 8.
Download original image
Number density profiles of selected source galaxies. Top: number density of selected galaxies ngal averaged over the nine cluster fields (black symbols) and averaged over the five 3D-HST/CANDELS fields (blue symbols) as a function of magnitude. We took into account the masks, for example, from bright stars in the images, and we only considered photometrically selected galaxies, that is, no flags from shape measurements or signal-to-noise ratio cuts were considered here. The error bars correspond to the uncertainty of the mean from the variation between the contributing cluster fields or 3D-HST/CANDELS fields, respectively. Bottom: average density of selected sources as a function of the distance to the X-ray cluster centre (except for the cluster SPT-CL J0646−6236, where we used the SZ centre). These distances are given in units of the radius R500c, SZ based on the SZ mass M500c, SZ. Blue lines indicate the average density and 1σ uncertainties from the five 3D-HST/CANDELS fields. The error bars correspond to the uncertainty of the mean from the variation between the contributing cluster fields or 3D-HST/CANDELS fields, respectively. We excluded the grey-shaded region when we measured weak lensing masses. It corresponds to 500 kpc or about 0.71 R500 for a cluster with R500 = 700 kpc.
Current usage metrics show cumulative count of Article Views (full-text article views including HTML views, PDF and ePub downloads, according to the available data) and Abstracts Views on Vision4Press platform.
Data correspond to usage on the plateform after 2015. The current usage metrics is available 48-96 hours after online publication and is updated daily on week days.
Initial download of the metrics may take a while.