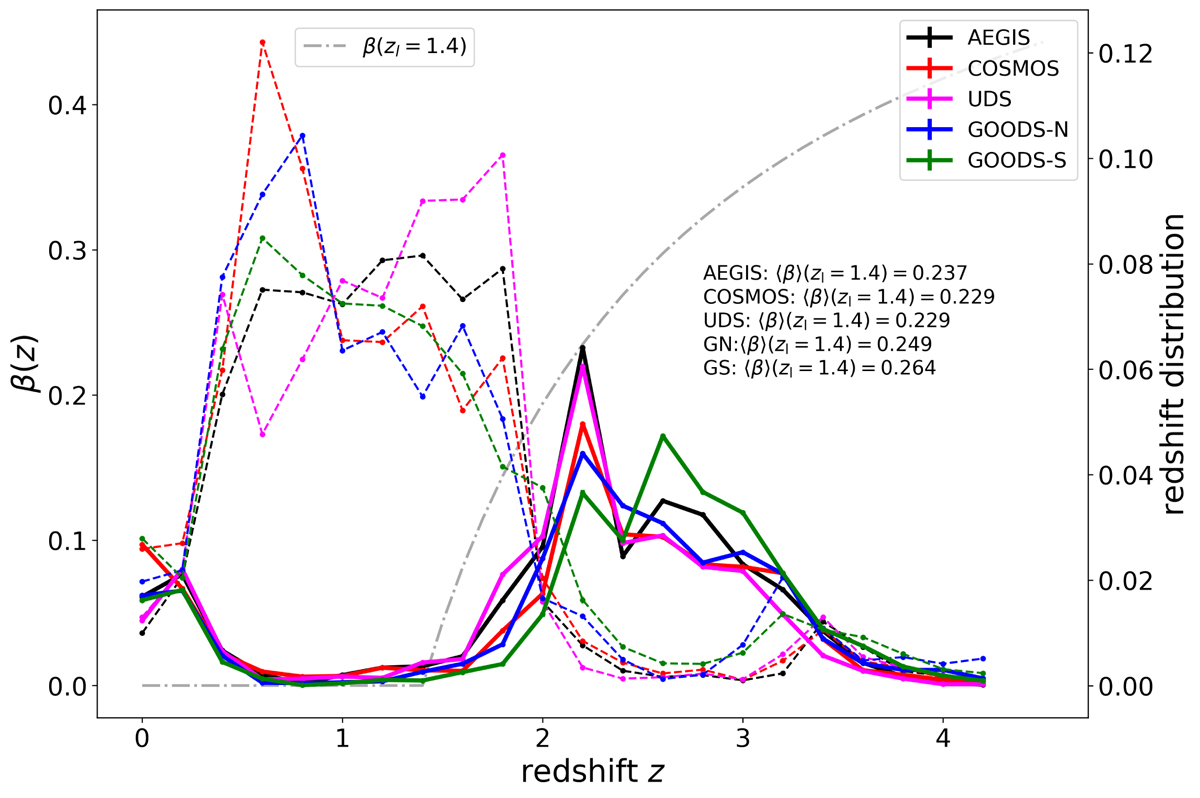
Fig. 7.
Download original image
Redshift distribution of the galaxies in the CANDELS/3D-HST fields for the colour selection for clusters at 1.2 ≲ z ≲ 1.7, employing the R20 photometric redshift catalogues. The selected source galaxies (solid lines) are mostly at redshift z ≳ 1.7. Removed galaxies (dashed lines) are mostly at redshifts z ≲ 1.7. We additionally display the average lensing efficiency curve as a function of redshift (grey dash-dotted line) at the median lens redshift of the clusters at zl = 1.4.
Current usage metrics show cumulative count of Article Views (full-text article views including HTML views, PDF and ePub downloads, according to the available data) and Abstracts Views on Vision4Press platform.
Data correspond to usage on the plateform after 2015. The current usage metrics is available 48-96 hours after online publication and is updated daily on week days.
Initial download of the metrics may take a while.