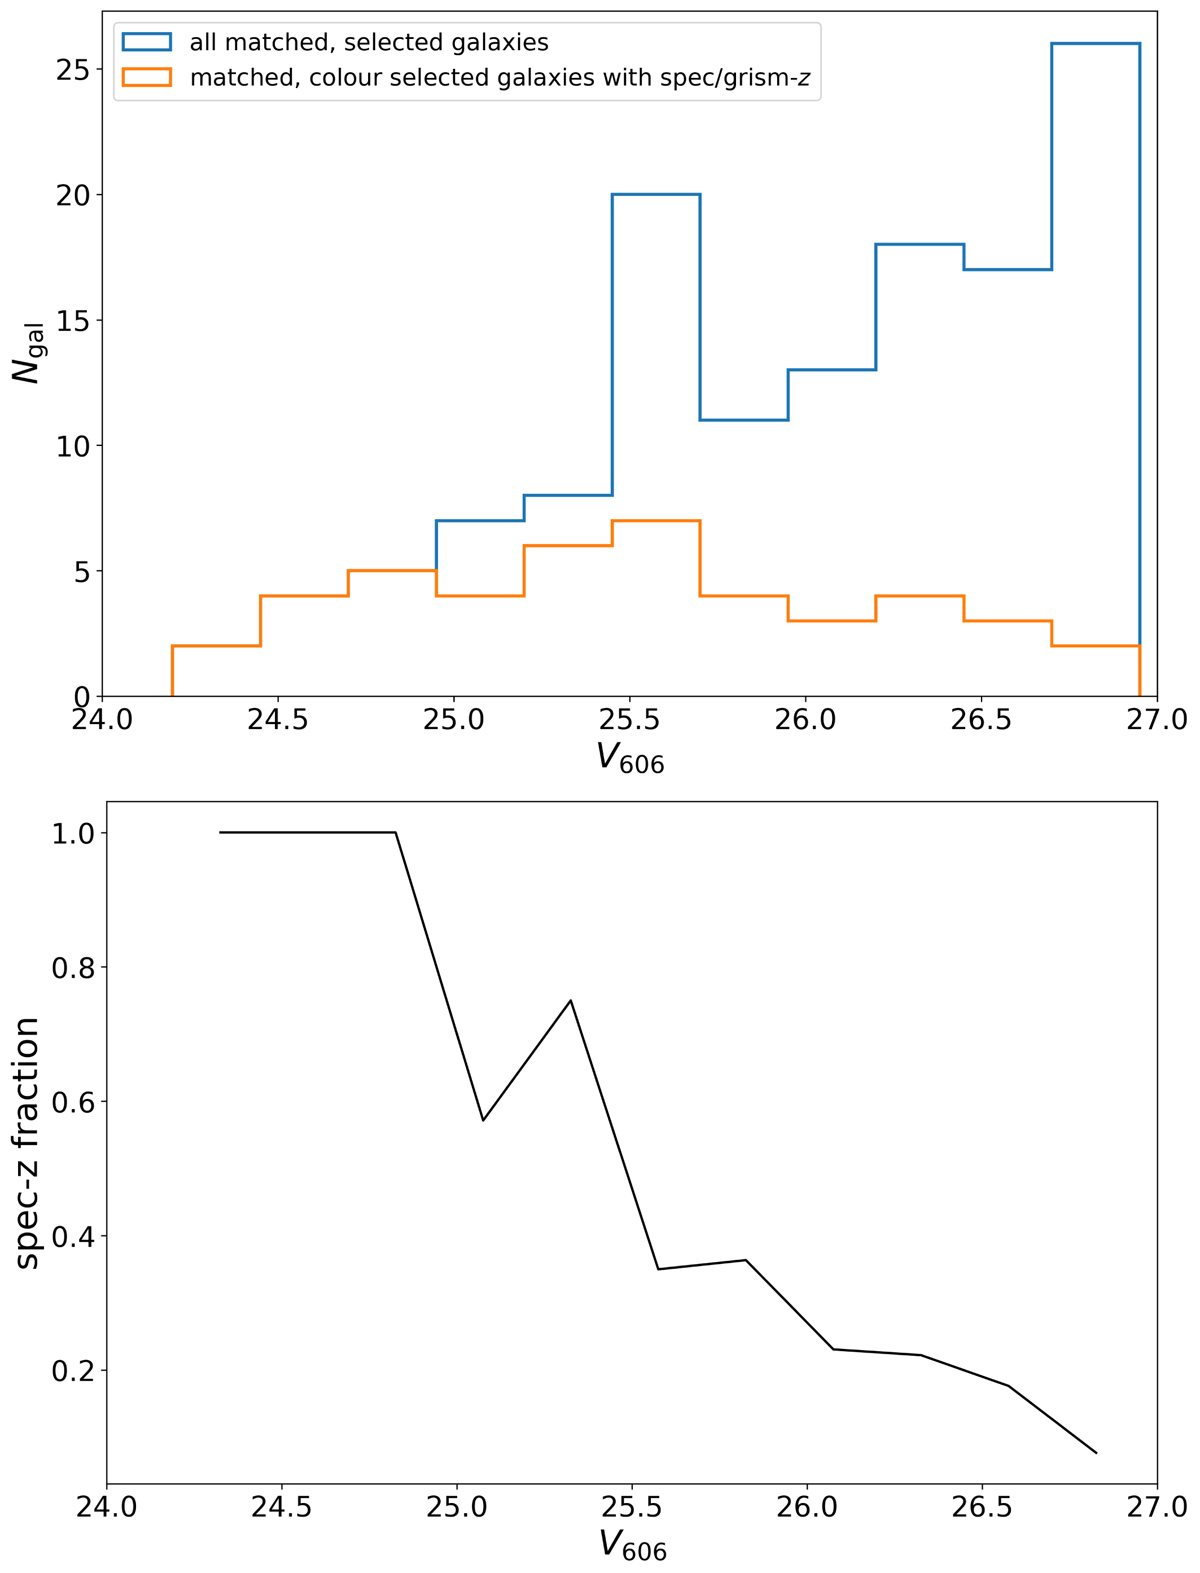
Fig. 6.
Download original image
Overview about available spectroscopic redshift information as a function of magnitude. Top: histogram of all matched and colour-selected galaxies within the HUDF region (blue). The orange histogram shows how many of these have a robust spec-z from MUSE or grism-z. Bottom: fraction of matched and colour-selected galaxies within the HUDF region with a robust spec-z from MUSE or grism-z, corresponding to the ratio of the orange and blue histogram in the top panel.
Current usage metrics show cumulative count of Article Views (full-text article views including HTML views, PDF and ePub downloads, according to the available data) and Abstracts Views on Vision4Press platform.
Data correspond to usage on the plateform after 2015. The current usage metrics is available 48-96 hours after online publication and is updated daily on week days.
Initial download of the metrics may take a while.