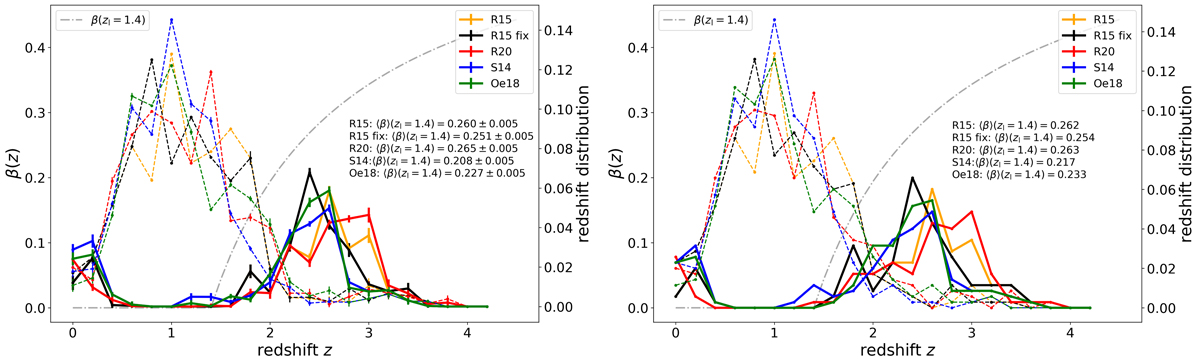
Fig. 4.
Download original image
Redshift distributions resulting from the colour selection for galaxy clusters at redshift 1.2 ≲ z ≲ 1.7 in the HUDF region. The selected source galaxies (solid lines) are mostly at redshift z ≳ 1.7. Removed galaxies (dashed lines) are mostly at redshifts z ≲ 1.7. The distributions only show galaxies matched between the five reference redshift catalogues (R15, R15_fix, R20, S14, and Oe18) and the photometric catalogue from this work. We additionally display the average lensing efficiency curve as a function of redshift (grey dash-dotted line) at the median lens redshift of the clusters at zl = 1.4. Left: redshift distributions for the five redshift catalogues and employing a colour selection based on the S14 photometry. The uncertainties represent the standard deviations from 50 noise realisations of the U band in the S14 photometry. Right: redshift distributions for the five redshift catalogues and employing a colour selection based on the LAMBDAR photometry measured from our observations of HUDF in UHIGH and from the S14 stacks in different HST-bands (see text).
Current usage metrics show cumulative count of Article Views (full-text article views including HTML views, PDF and ePub downloads, according to the available data) and Abstracts Views on Vision4Press platform.
Data correspond to usage on the plateform after 2015. The current usage metrics is available 48-96 hours after online publication and is updated daily on week days.
Initial download of the metrics may take a while.