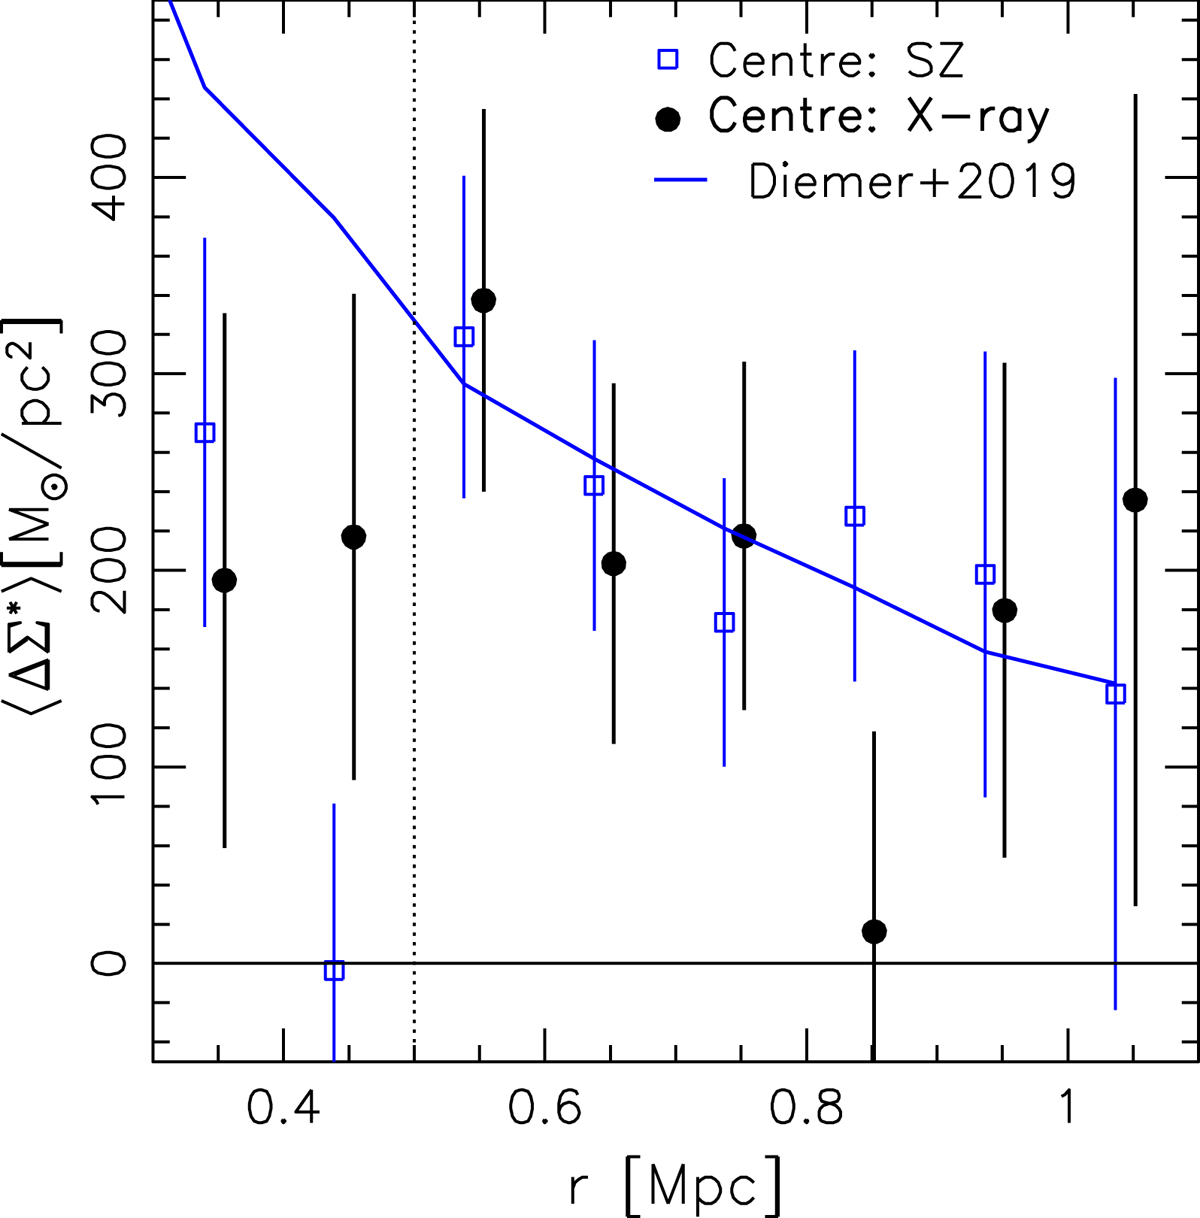
Fig. G.1.
Download original image
Weighted average of the rescaled differential surface mass density profiles for the clusters in our sample. The black points and blue squares refer to measurements using the X-ray (all clusters except SPT-CL J0646−6236 for which we do not have X-ray measurements) and SZ centres, respectively. The blue line shows the average weighted model NFW function assuming a fixed concentration–mass relation following Diemer & Kravtsov (2015) with updated parameters from Diemer & Joyce (2019) for measurements from the SZ centres. The vertical dotted line indicates the lower limit of our fit range.
Current usage metrics show cumulative count of Article Views (full-text article views including HTML views, PDF and ePub downloads, according to the available data) and Abstracts Views on Vision4Press platform.
Data correspond to usage on the plateform after 2015. The current usage metrics is available 48-96 hours after online publication and is updated daily on week days.
Initial download of the metrics may take a while.