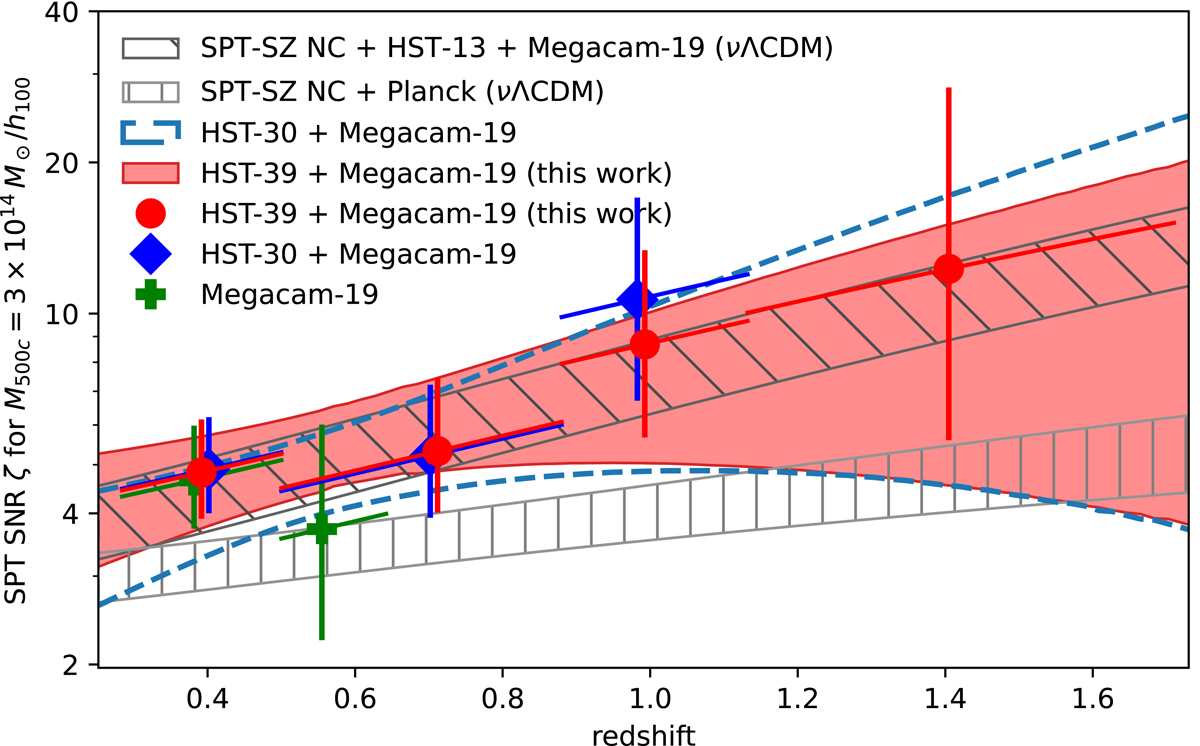
Fig. 10.
Download original image
Evolution of the unbiased SPT detection significance ζ at the pivot mass 3 × 10¹⁴ M⊙/h100 as a function of redshift. The red band indicates the main result of this work. The blue dashed curves indicate the corresponding 1σ band from the S21 analysis for comparison. The red and blue data points represent the corresponding binned analyses. They are placed in the centre of the bins. Horizontal error bars represent the bin widths. The redshift evolution parameter is fixed to CSZ = 1.34 for our binned analysis. The diagonally hatched and vertically hatched bands correspond to the relations from the B19 study and the SPT cluster counts in combination with a flat PlanckνΛCDM cosmology, respectively. The displayed uncertainties correspond to the 68% credible interval (bands for the full relation and error bars for the binned analysis).
Current usage metrics show cumulative count of Article Views (full-text article views including HTML views, PDF and ePub downloads, according to the available data) and Abstracts Views on Vision4Press platform.
Data correspond to usage on the plateform after 2015. The current usage metrics is available 48-96 hours after online publication and is updated daily on week days.
Initial download of the metrics may take a while.