Open Access
Fig. 8.
Download original image
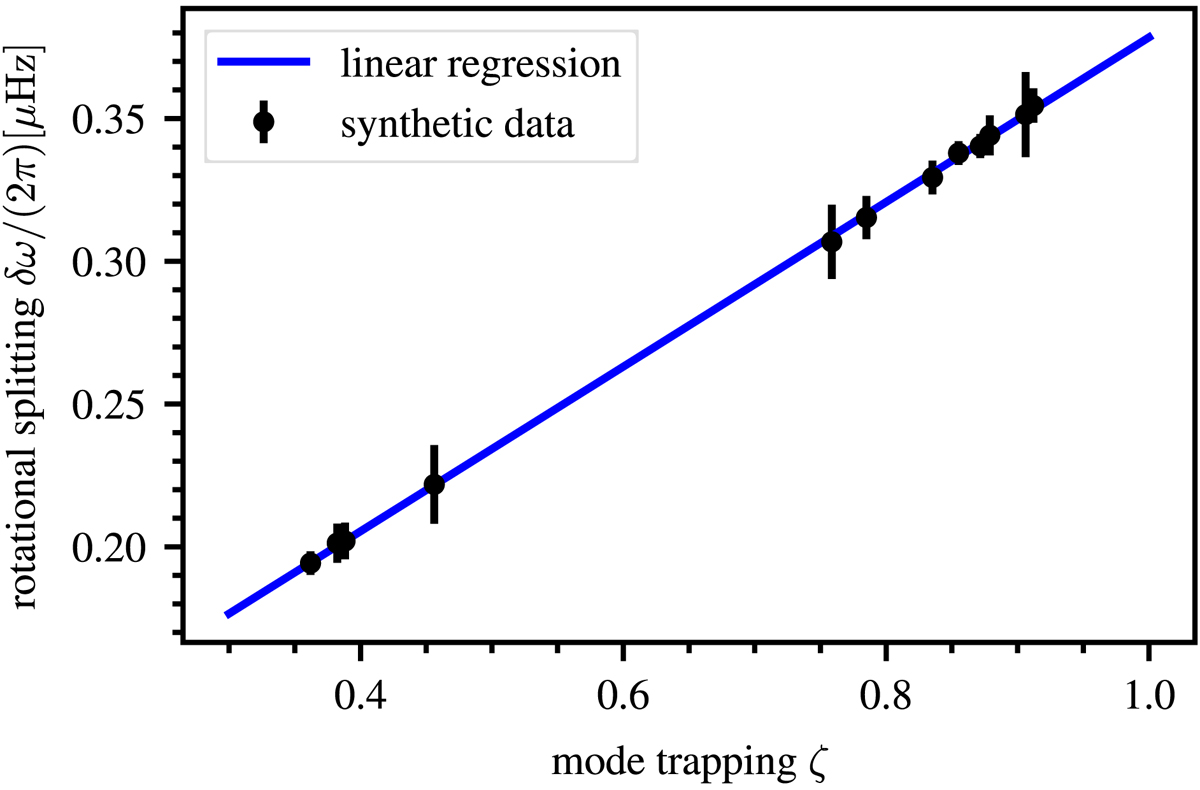
Rotational splitting δω as a function of the mode trapping ζ = Icore/I are shown with the black marker. The blue line indicates a fit to the data obtained by means of linear regression as described by Eq. (14). We note that modes with a low ζ are p-dominated, while modes with a high ζ are g-dominated.
Current usage metrics show cumulative count of Article Views (full-text article views including HTML views, PDF and ePub downloads, according to the available data) and Abstracts Views on Vision4Press platform.
Data correspond to usage on the plateform after 2015. The current usage metrics is available 48-96 hours after online publication and is updated daily on week days.
Initial download of the metrics may take a while.