Fig. 6.
Download original image
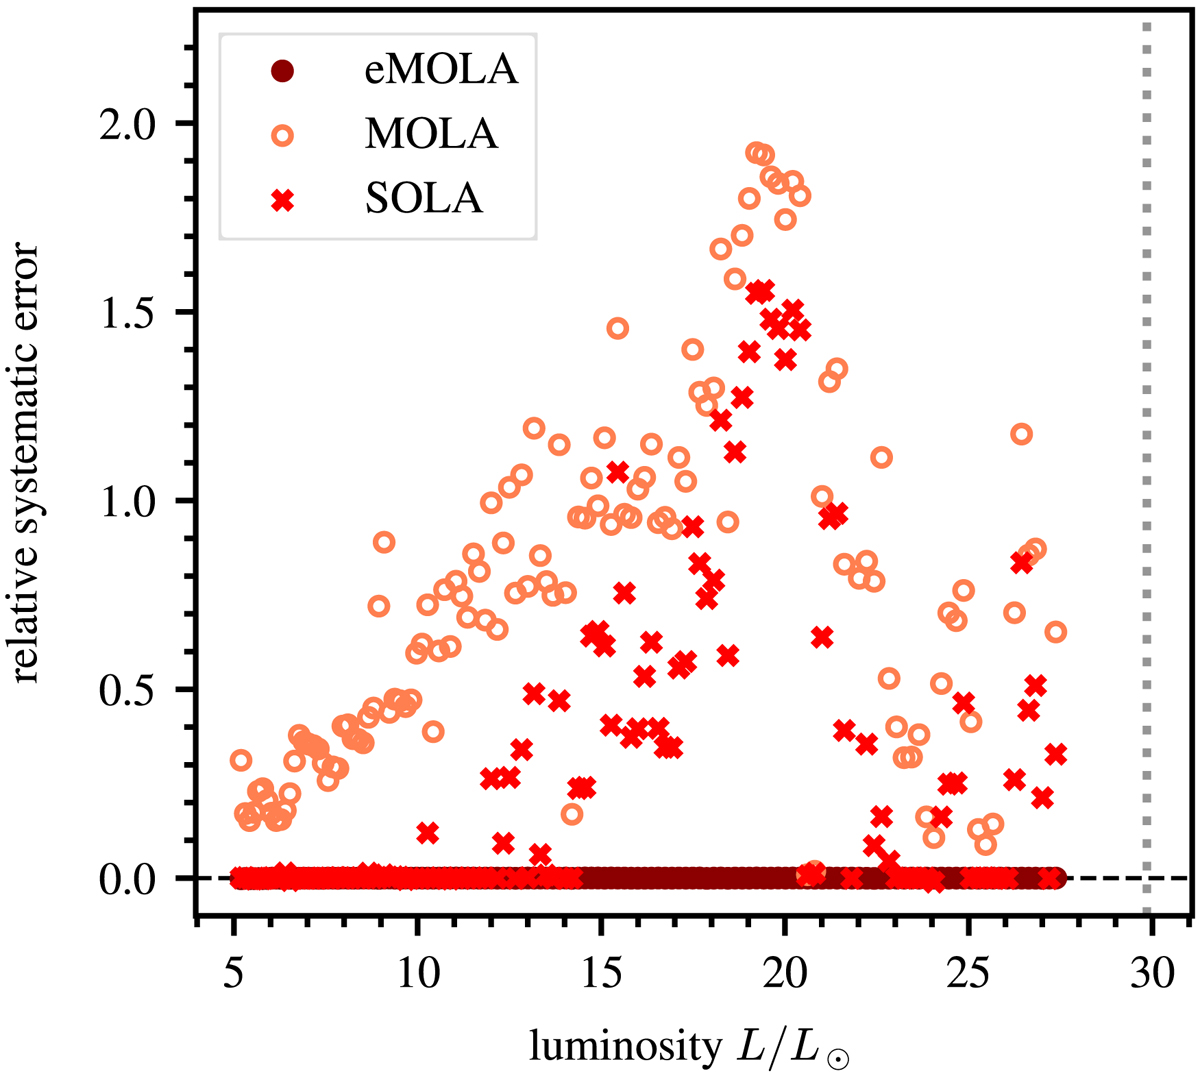
Relative systematic errors of the envelope rotation rates as a function of luminosity for MOLA, SOLA, and eMOLA inversions shown with light red, red, and dark red points, respectively, for the 1 M⊙ track. The bump luminosity is shown with a vertical dotted grey line. Here, the envelope step profile has been used. Results for the 1.5 and 2 M⊙ tracks show the same behaviour. In contrast to MOLA and SOLA inversions, the eMOLA results do not suffer from systematic errors.
Current usage metrics show cumulative count of Article Views (full-text article views including HTML views, PDF and ePub downloads, according to the available data) and Abstracts Views on Vision4Press platform.
Data correspond to usage on the plateform after 2015. The current usage metrics is available 48-96 hours after online publication and is updated daily on week days.
Initial download of the metrics may take a while.