Fig. 3.
Download original image
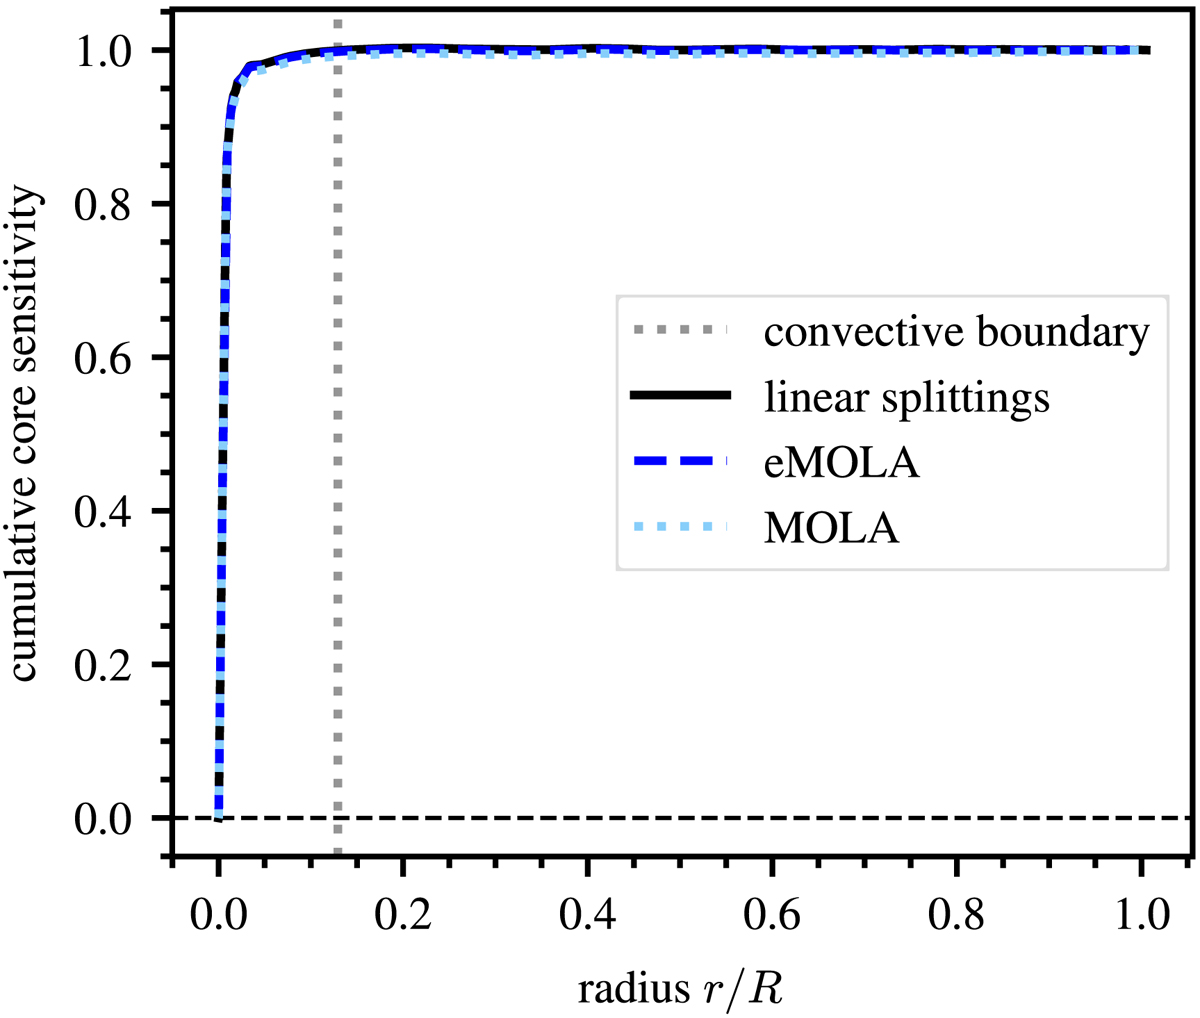
Comparison of cumulative SKs for the core rotation rate, Ωcore, as a function of radius for synthetic data. The results obtained with the eMOLA and the MOLA inversions are shown with blue and light blue lines, respectively. The dotted grey line indicates the base of the convective envelope. The black line shows the cumulative SK for the core rotation obtained with the LSA. The construction of the SKs by applying the LSA is described in Sect. 5.
Current usage metrics show cumulative count of Article Views (full-text article views including HTML views, PDF and ePub downloads, according to the available data) and Abstracts Views on Vision4Press platform.
Data correspond to usage on the plateform after 2015. The current usage metrics is available 48-96 hours after online publication and is updated daily on week days.
Initial download of the metrics may take a while.