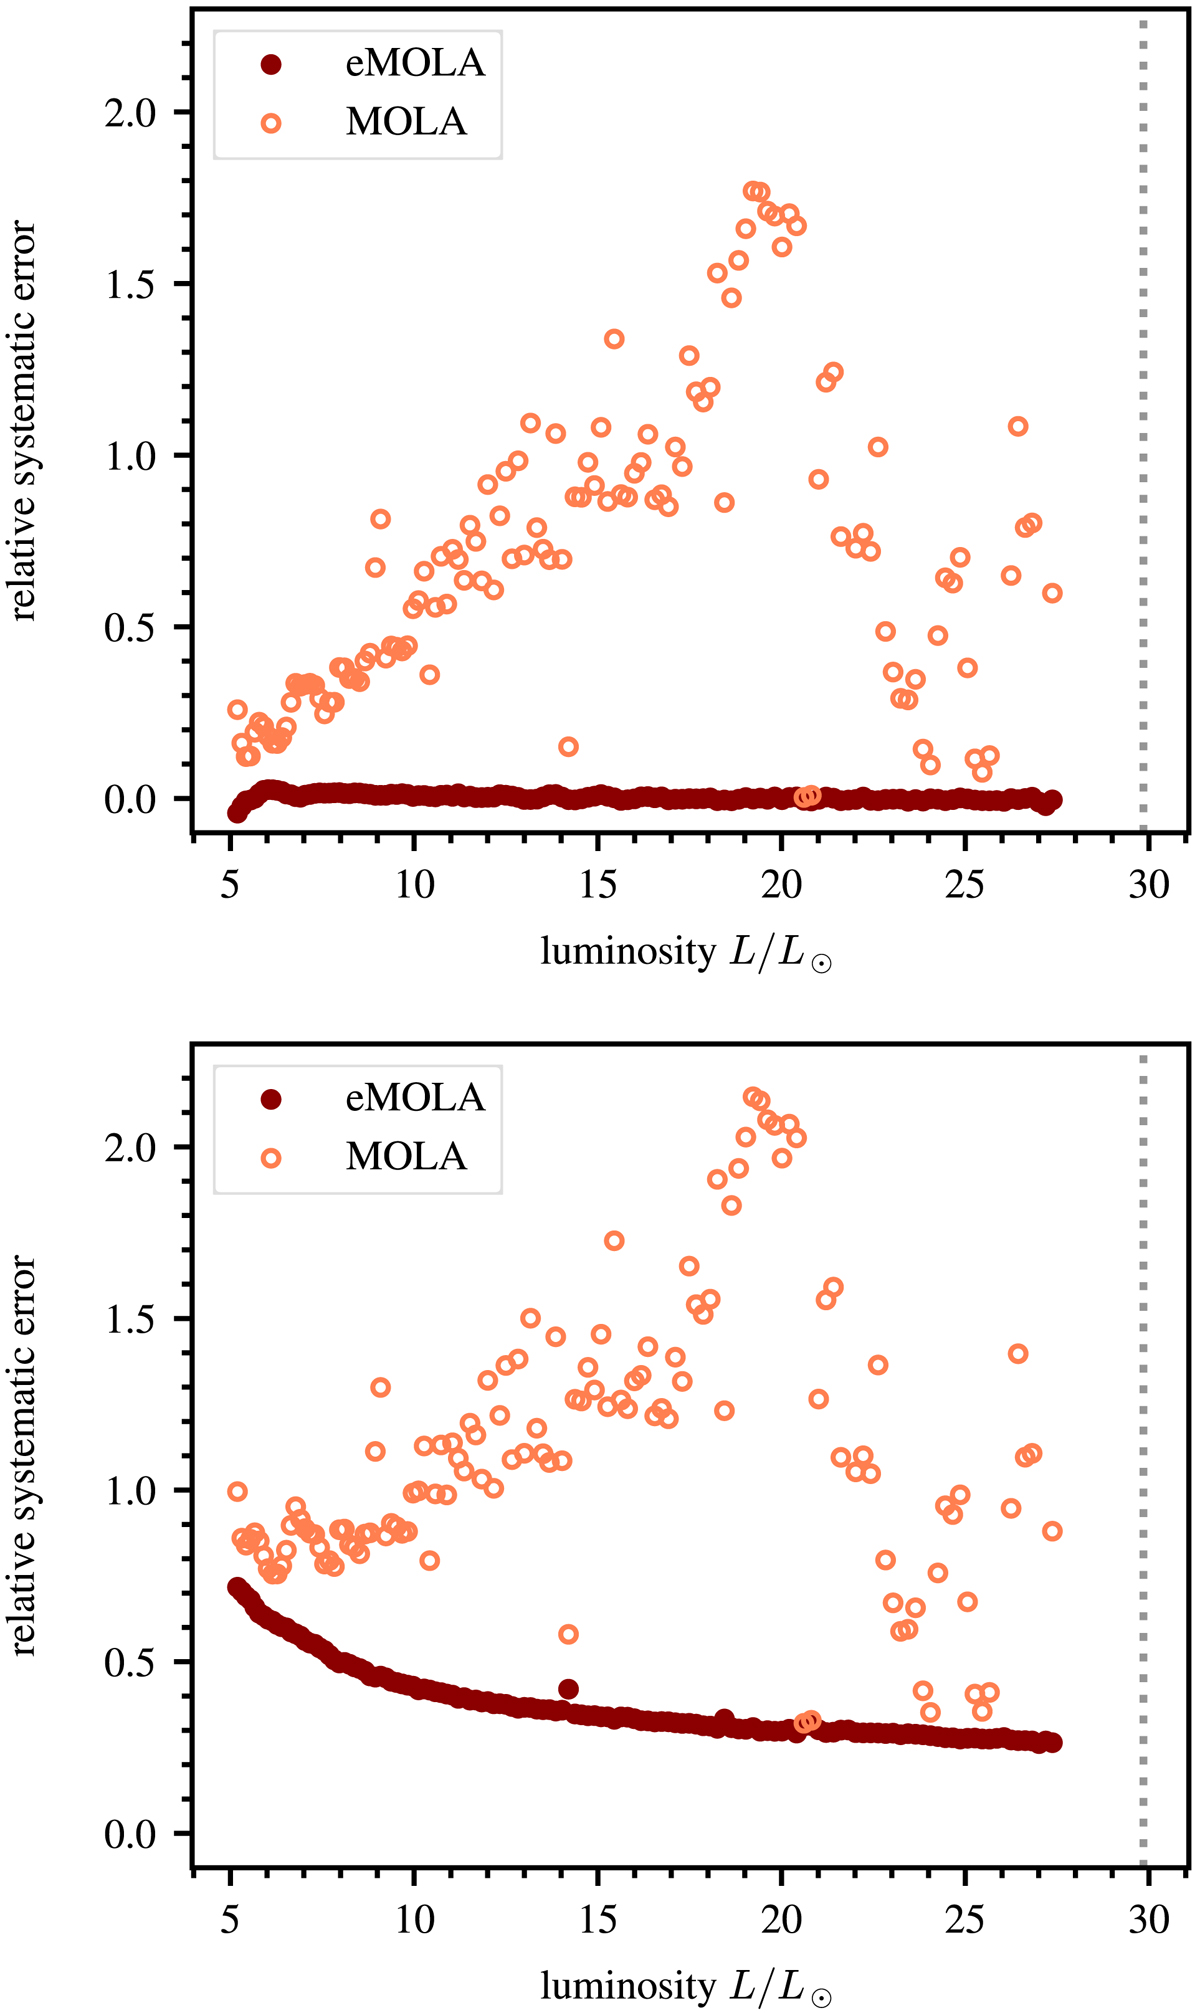
Fig. D.1.
Download original image
Relative systematic errors of the envelope rotation rates as a function of luminosity for MOLA and eMOLA inversions, shown with light and dark red points, respectively. The bump luminosity is shown with vertical dotted grey line. The upper panel shows the core step profile, in which eMOLA virtually eliminates the systematic errors that are present in the MOLA inversions. The lower panel shows the convective power law profile. The errors from eMOLA are generally much smaller than those from MOLA.
Current usage metrics show cumulative count of Article Views (full-text article views including HTML views, PDF and ePub downloads, according to the available data) and Abstracts Views on Vision4Press platform.
Data correspond to usage on the plateform after 2015. The current usage metrics is available 48-96 hours after online publication and is updated daily on week days.
Initial download of the metrics may take a while.