Fig. C.3.
Download original image
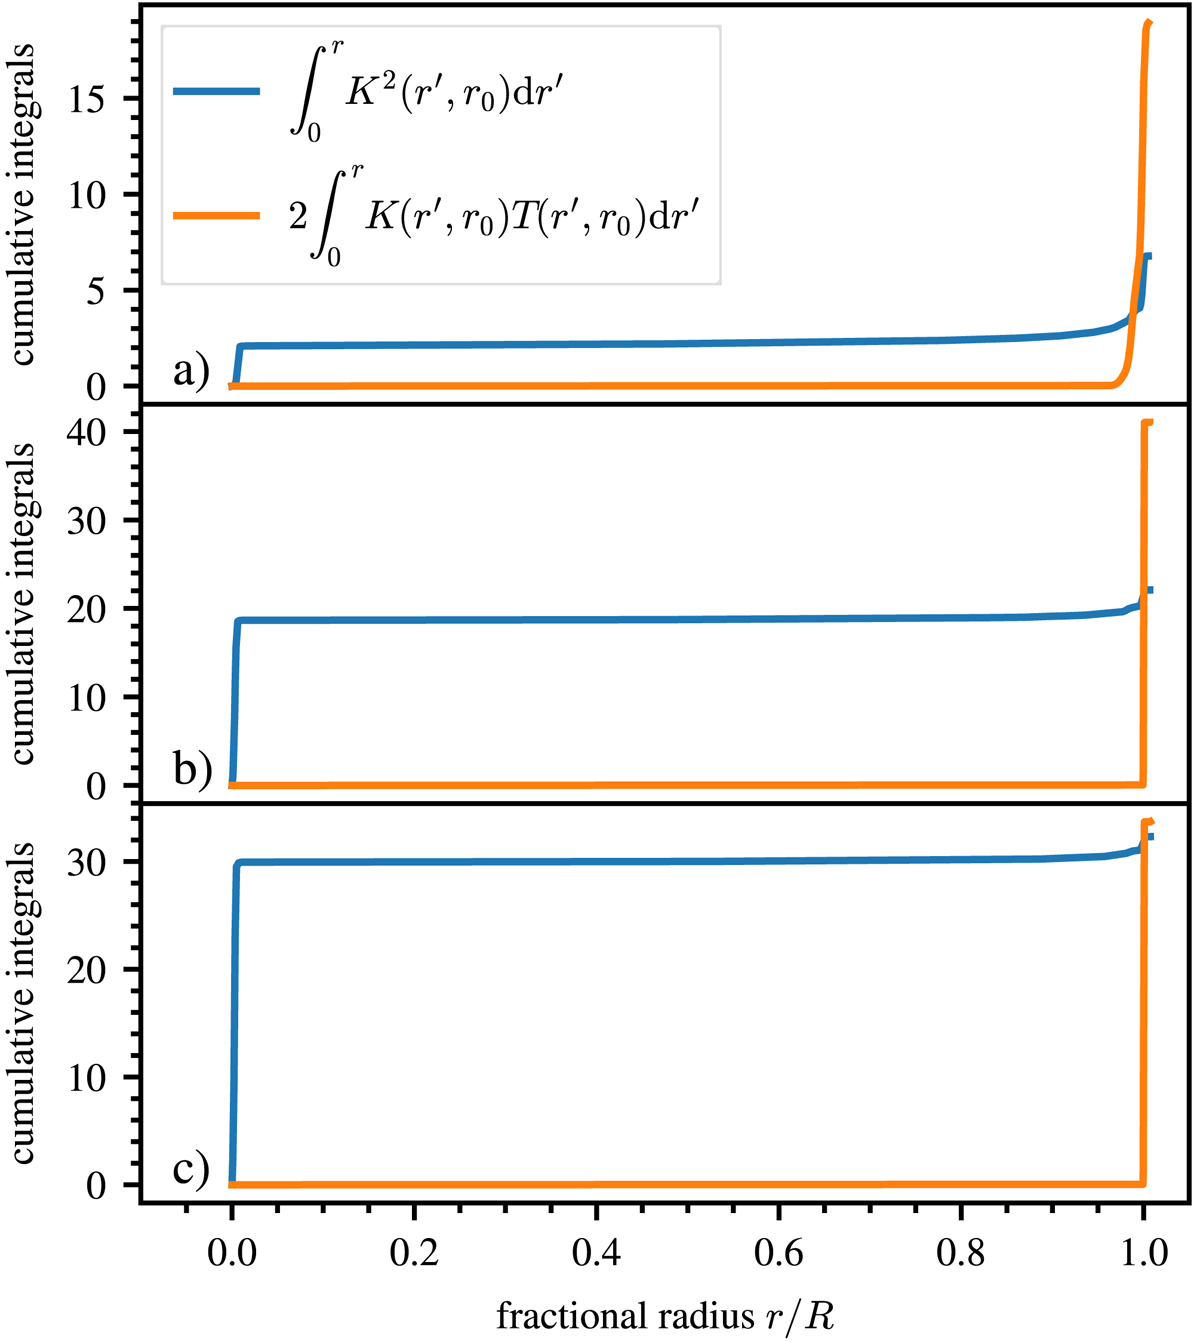
Cumulative integral of the first and second term of the SOLA objective function, Eq. (C.3), for optimal values of Δ as a function of fractional radius, shown with a blue and orange line, respectively. Panel a) corresponds to the model discussed in Sect. 3, panel b) corresponds to a model around 15 L⊙, and panel c) corresponds to a model at about 20 L⊙, that is, right at the maximum of systematic errors in Fig. 6.
Current usage metrics show cumulative count of Article Views (full-text article views including HTML views, PDF and ePub downloads, according to the available data) and Abstracts Views on Vision4Press platform.
Data correspond to usage on the plateform after 2015. The current usage metrics is available 48-96 hours after online publication and is updated daily on week days.
Initial download of the metrics may take a while.