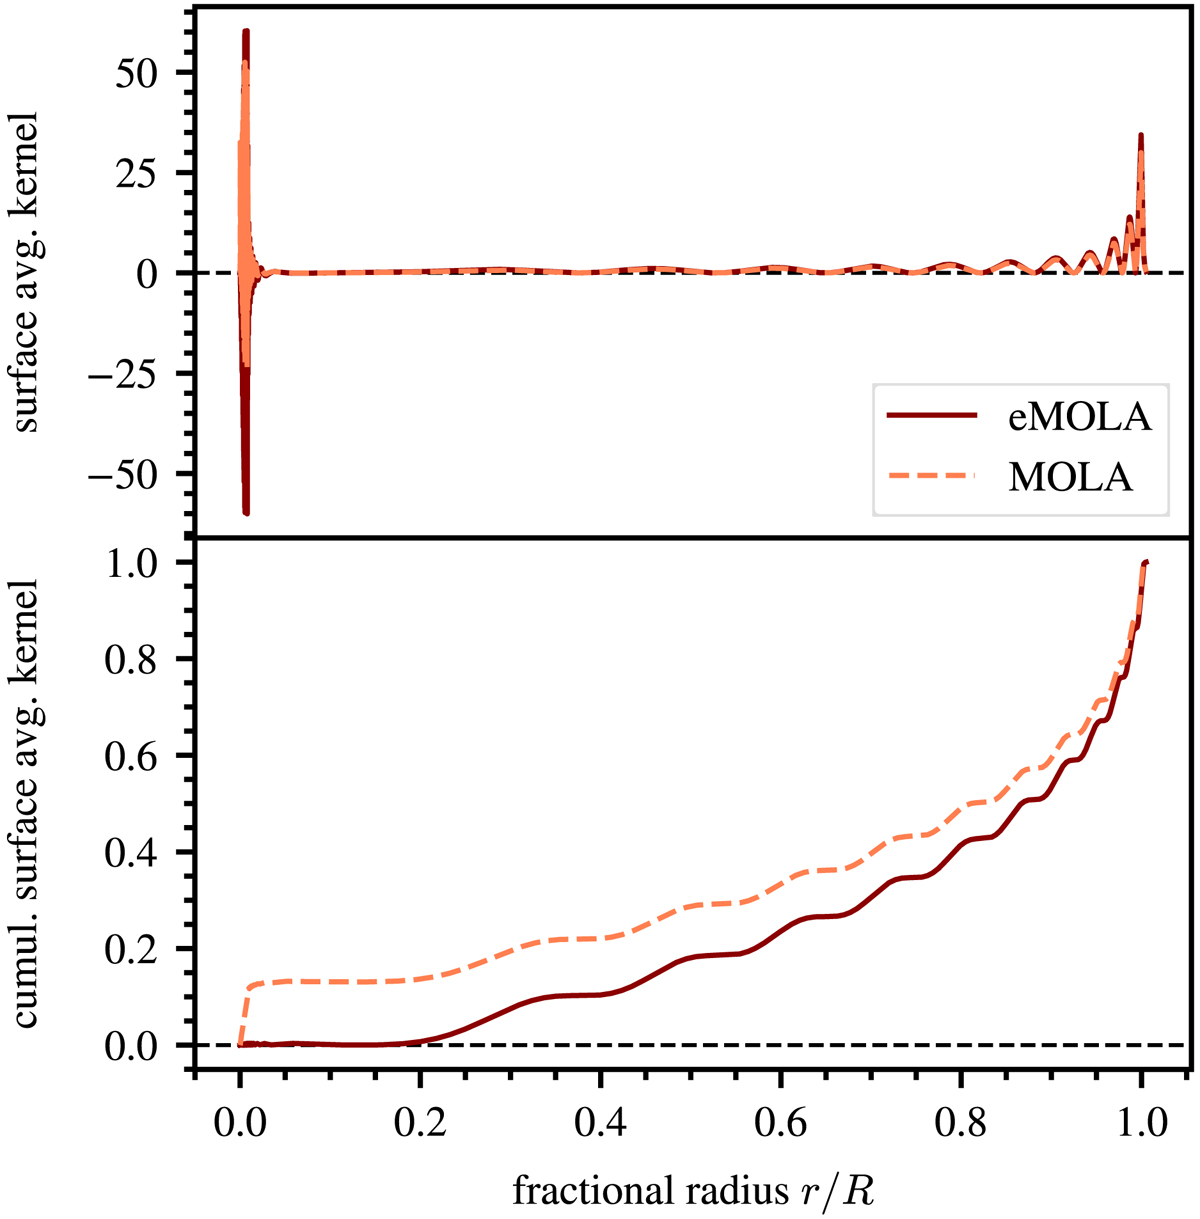
Fig. 12.
Download original image
SAKs (upper panel) and cumulative SAKs (lower panel) as a function of the fractional radius computed using different inversion methods for a mode set containing one p- and one g-dominated mode. The results for the eMOLA inversion are shown with a solid dark red line and the MOLA results are indicated with the dashed light red line. In contrast to the eMOLA results, the MOLA SAK shows substantial cumulative core sensitivity.
Current usage metrics show cumulative count of Article Views (full-text article views including HTML views, PDF and ePub downloads, according to the available data) and Abstracts Views on Vision4Press platform.
Data correspond to usage on the plateform after 2015. The current usage metrics is available 48-96 hours after online publication and is updated daily on week days.
Initial download of the metrics may take a while.