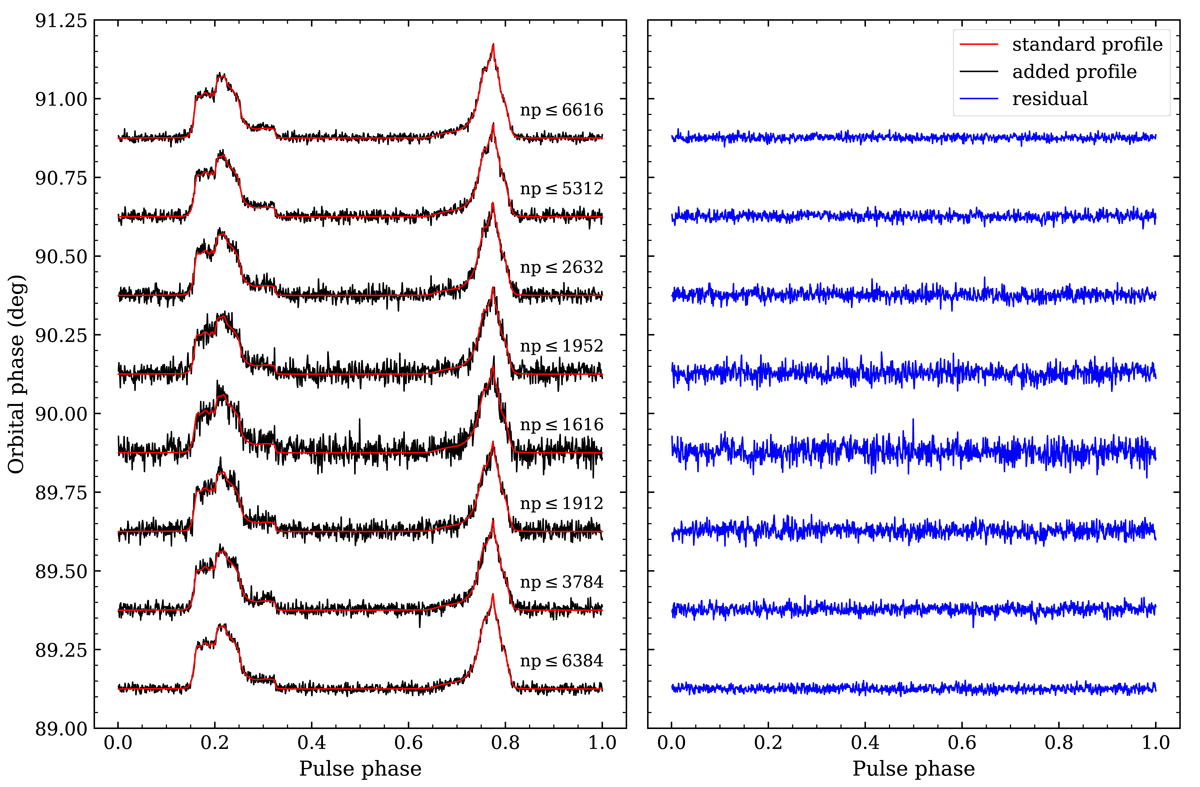
Fig. 8.
Download original image
Profile variation with respect to orbital phase. Left: black lines indicate the integrated profile of L-band data summed from 25 eclipses for orbital phases 89° < ψ < 91° with an interval of Δψ = 0.25°. The baseline of the profile is placed at the centre of each interval, and the numbers on the right side of the profiles (np) indicate the estimated upper limit for the number of pulses in that interval. The red curves indicate the reference (standard) profile integrated over a 2 h observation excluding the eclipse part. Right: residuals of the added profile with respect to the reference profile.
Current usage metrics show cumulative count of Article Views (full-text article views including HTML views, PDF and ePub downloads, according to the available data) and Abstracts Views on Vision4Press platform.
Data correspond to usage on the plateform after 2015. The current usage metrics is available 48-96 hours after online publication and is updated daily on week days.
Initial download of the metrics may take a while.