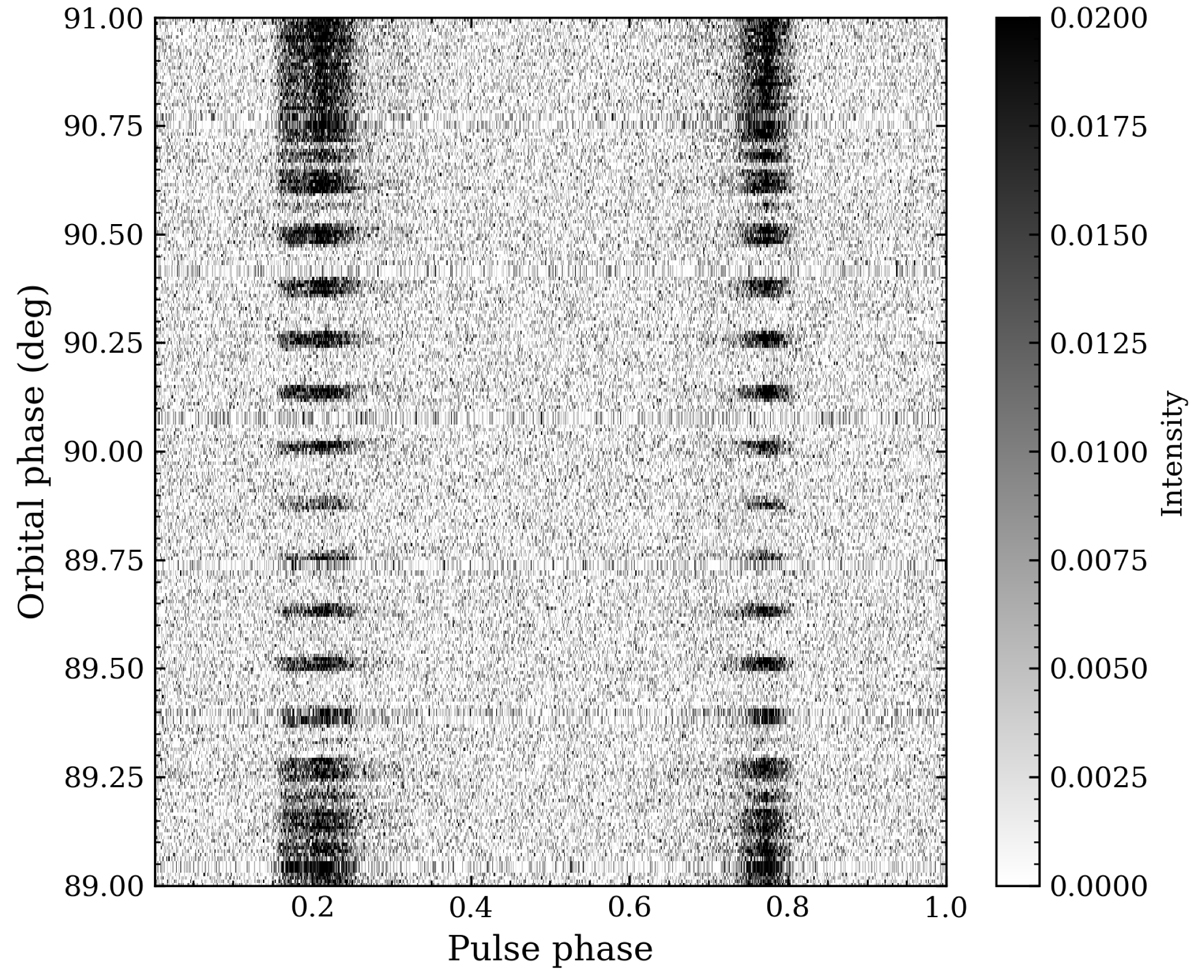
Fig. 6.
Download original image
Example of one eclipse observation at UHF band, plotted in intensity against orbital phase ψ and pulse phase. The intensity modulation occurs when pulsar A is eclipsed by the magnetosphere of pulsar B. Each integration is a sum of eight pulses. When plotting, the discontinuities between recordings are patched with the previous sub-integration.
Current usage metrics show cumulative count of Article Views (full-text article views including HTML views, PDF and ePub downloads, according to the available data) and Abstracts Views on Vision4Press platform.
Data correspond to usage on the plateform after 2015. The current usage metrics is available 48-96 hours after online publication and is updated daily on week days.
Initial download of the metrics may take a while.