Fig. 5.
Download original image
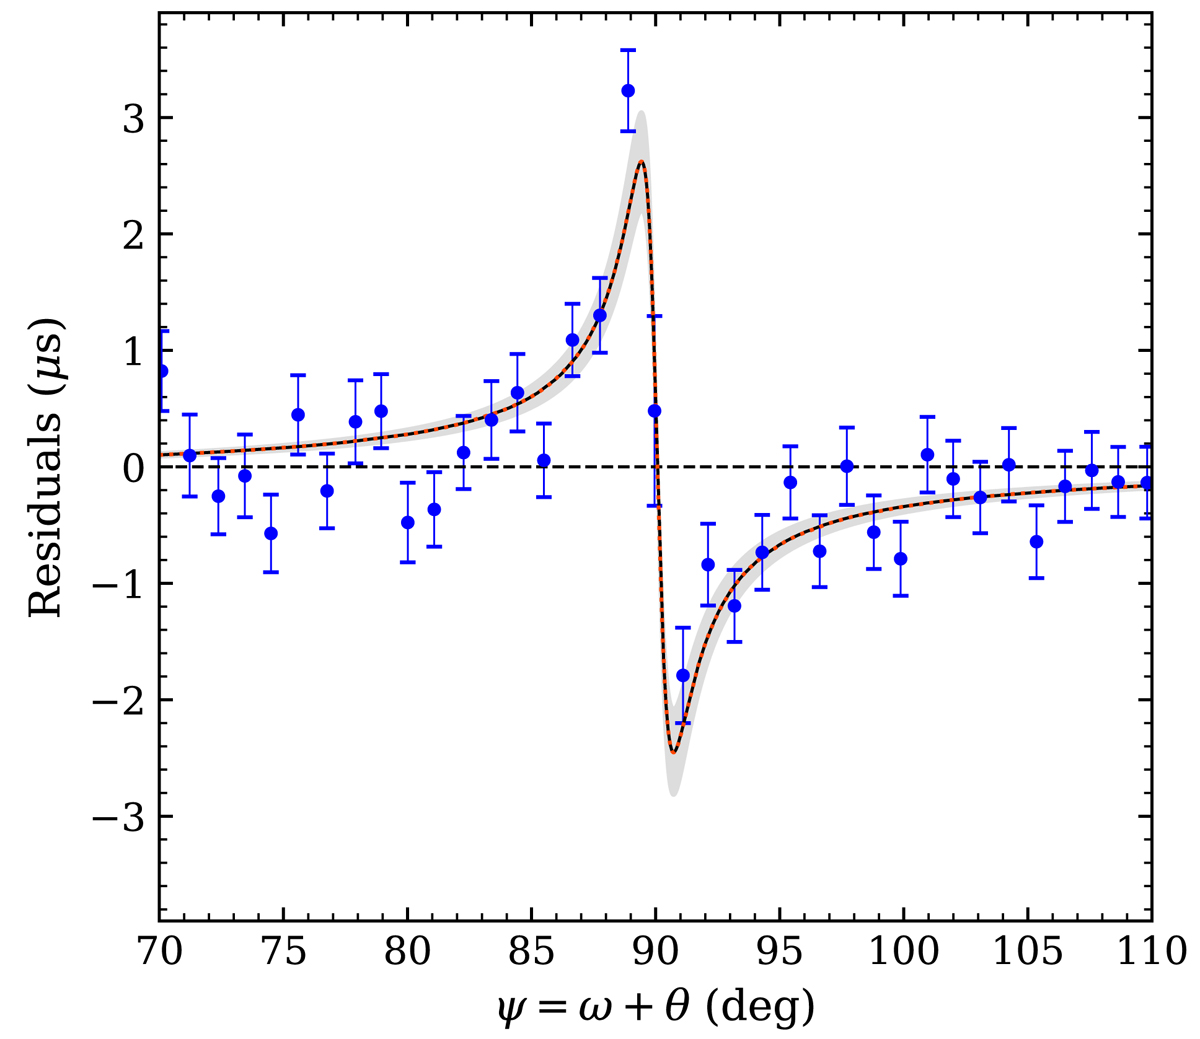
Aggregated residuals (blue) due to NLO contributions in Shapiro and aberration delay, shown in the orbital phase ψ. Residuals are re-scaled by (1 + eT cos θ)−1 to account for secular variations in amplitude due to the precession of periastron. The black curve indicates the fitted qNLO (see Table 2) with the 2σ range shown by the grey shaded areas, which agrees very well with the theoretical prediction indicated by the red dotted line.
Current usage metrics show cumulative count of Article Views (full-text article views including HTML views, PDF and ePub downloads, according to the available data) and Abstracts Views on Vision4Press platform.
Data correspond to usage on the plateform after 2015. The current usage metrics is available 48-96 hours after online publication and is updated daily on week days.
Initial download of the metrics may take a while.