Fig. A.5.
Download original image
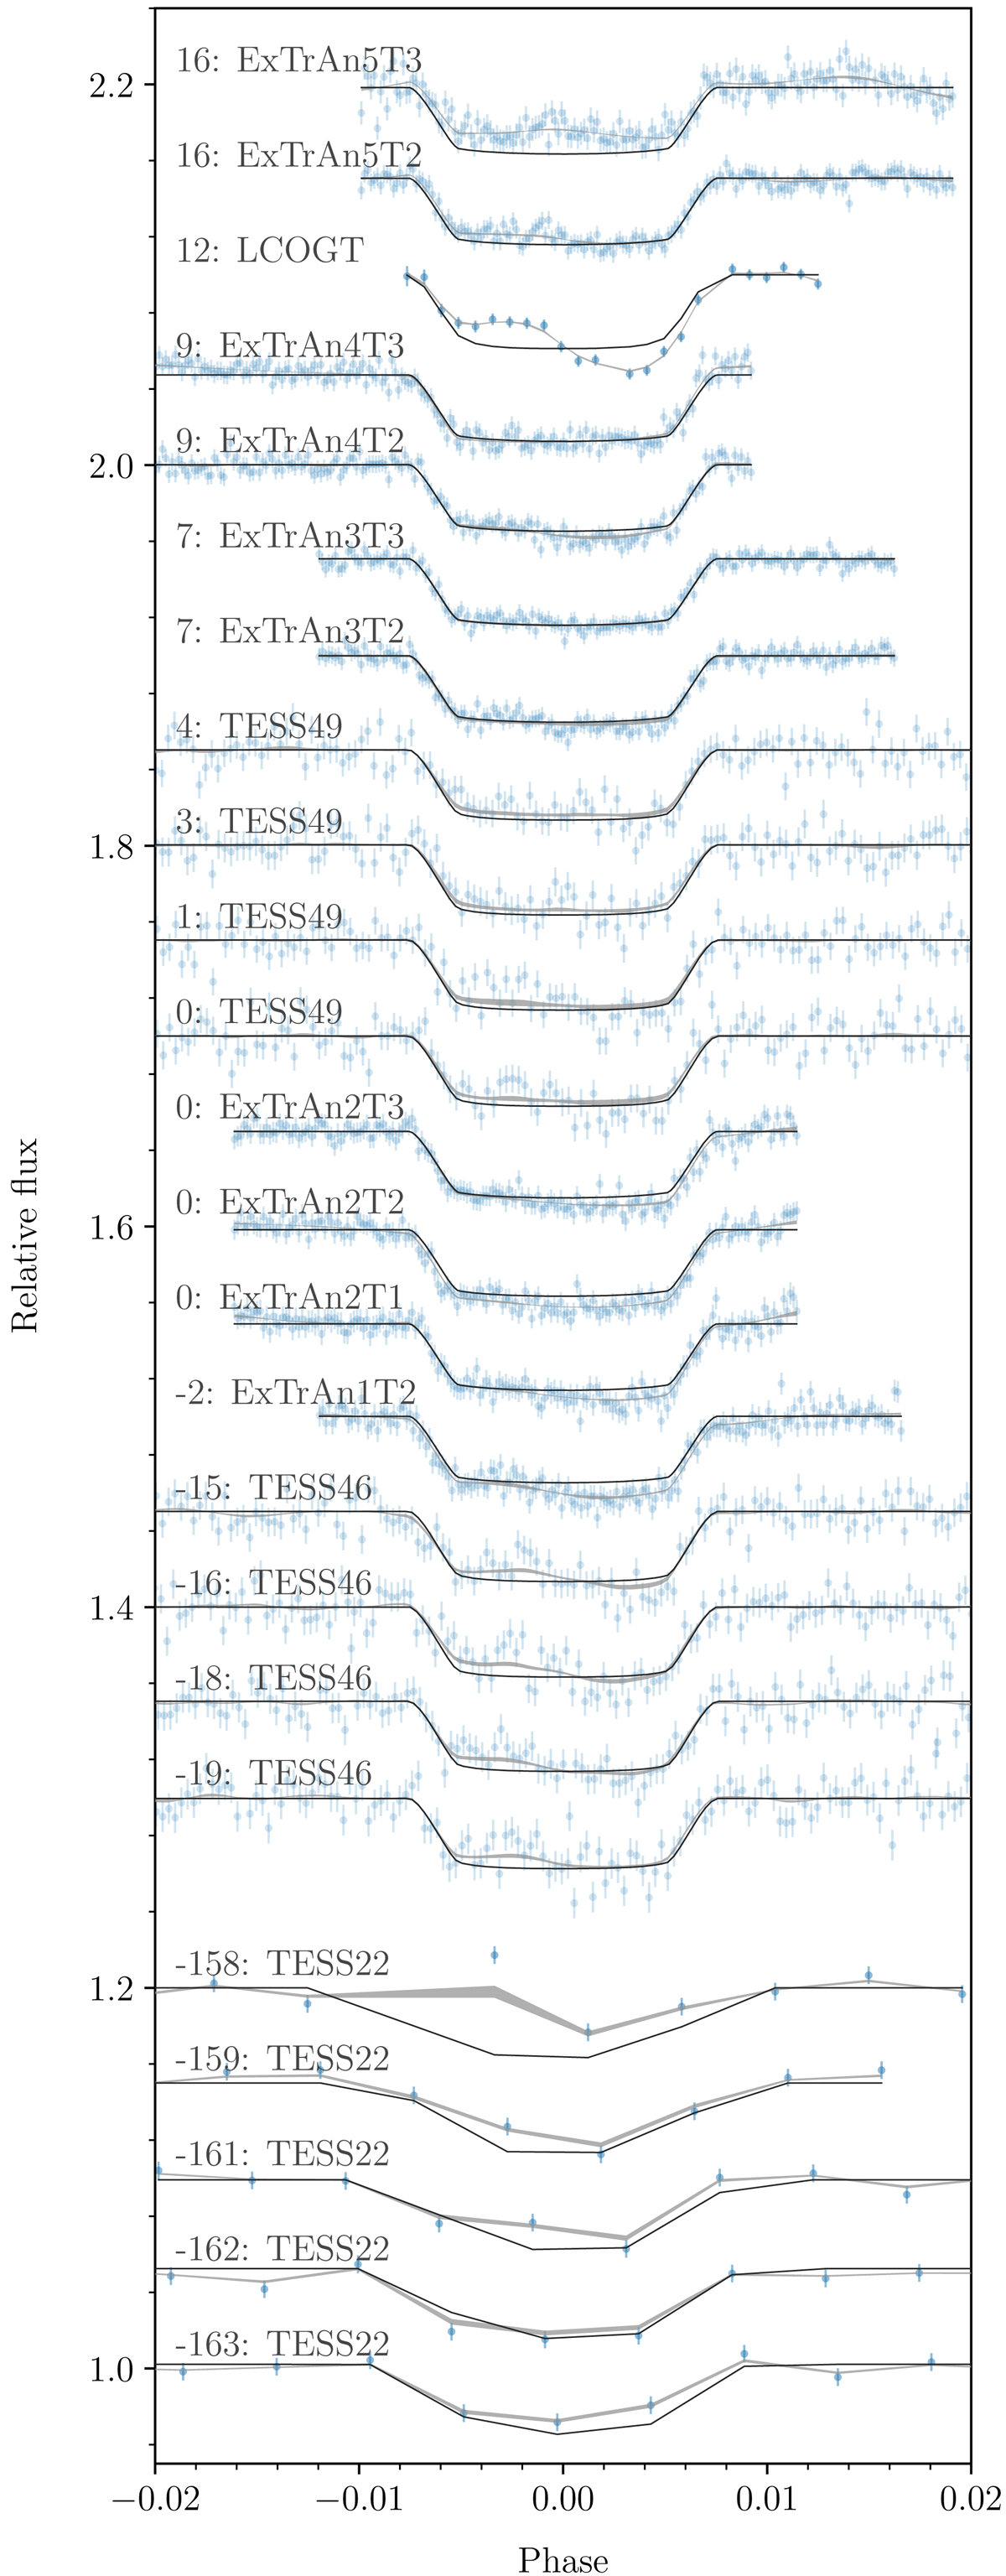
TESS, ExTrA, and LCOGT transits (offset for clarity) modelled with juliet. The blue symbols with error bars are the data, the grey line is the juliet posterior median model, and the black line is the corresponding pure transit model. Each transit is labelled with the epoch relative to T0, the sector for transits observed with TESS, and the night and the telescope for transits observed with ExTrA.
Current usage metrics show cumulative count of Article Views (full-text article views including HTML views, PDF and ePub downloads, according to the available data) and Abstracts Views on Vision4Press platform.
Data correspond to usage on the plateform after 2015. The current usage metrics is available 48-96 hours after online publication and is updated daily on week days.
Initial download of the metrics may take a while.