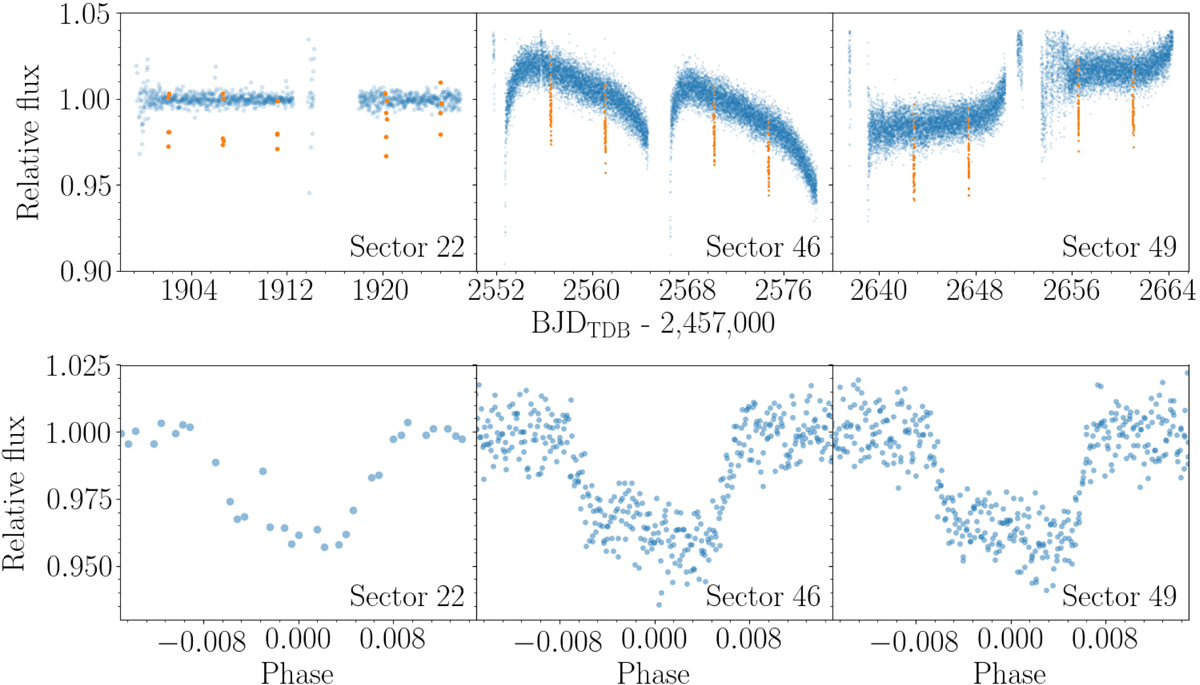
Fig. A.2.
Download original image
TESS observations. Top: Light curves from QLP KSPSAP (sector 22) and SPOC SAP (sectors 46 and 49) are shown by blue dots, with the transits of TOI-3884 b highlighted in orange. The SAP light curves do not show significant variability, apart from the one due to the satellite orbit. Bottom: Transits observed by TESS folded for each sector.
Current usage metrics show cumulative count of Article Views (full-text article views including HTML views, PDF and ePub downloads, according to the available data) and Abstracts Views on Vision4Press platform.
Data correspond to usage on the plateform after 2015. The current usage metrics is available 48-96 hours after online publication and is updated daily on week days.
Initial download of the metrics may take a while.