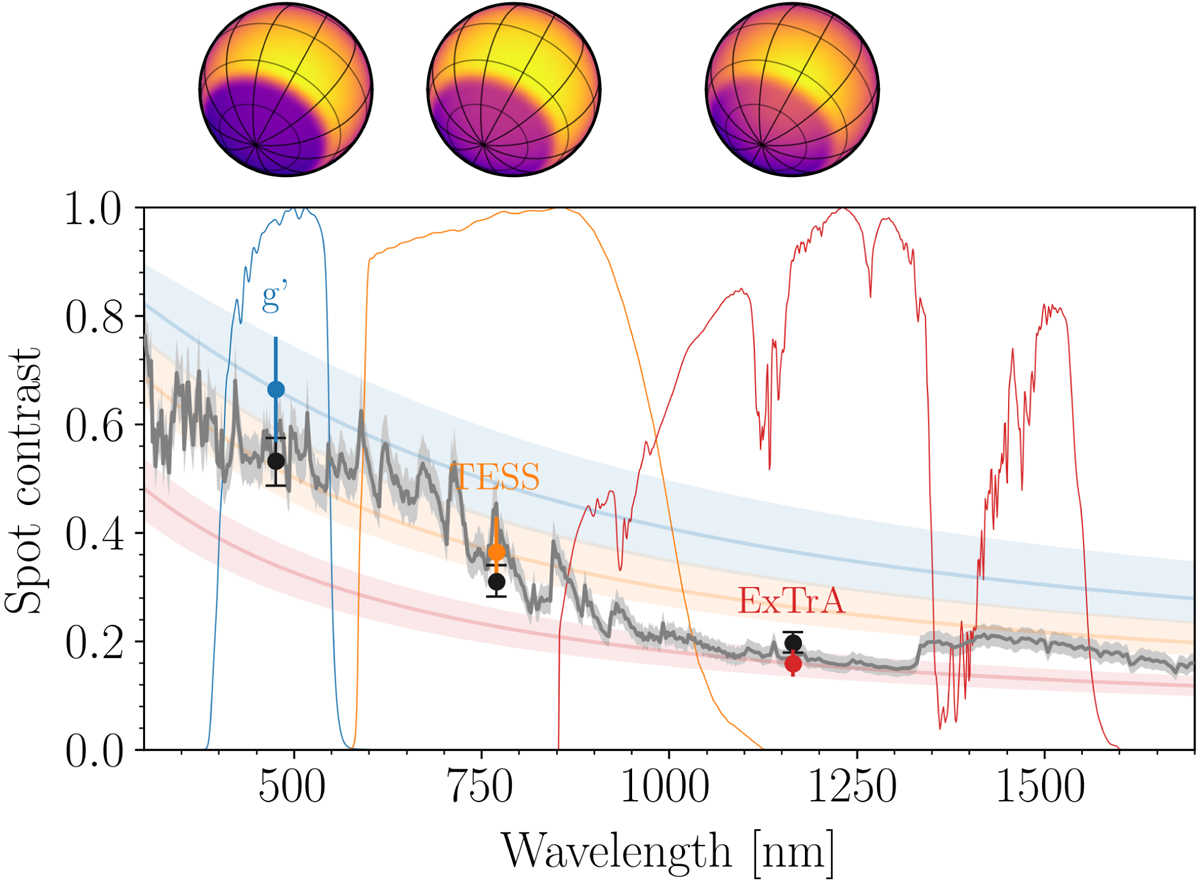
Fig. A.9.
Download original image
Polar spot contrast as a function of the photometric band (blue for g’, orange for TESS, and red for ExTrA) from the analysis of Sect. 4. The g’ and TESS transmission curves were retrieved from the SVO Filter Profile Service (http://svo2.cab.inta-csic.es/theory/fps/, Rodrigo et al. 2012; Rodrigo & Solano 2020). The blue, orange, and red bands represent the median and the 68% CI of the contrast as a function of wavelength predicted by the corresponding band contrast measurement assuming blackbody emission. The black error bars and grey curves are the posterior (median and the 68% CI) of the measured contrast and the contrast as a function of wavelength, respectively, from the modelling using the PHOENIX/BT-Settl stellar atmosphere models (Sect. B). Above the panel: Model of the stellar surface as seen at each band for the median posterior values
Current usage metrics show cumulative count of Article Views (full-text article views including HTML views, PDF and ePub downloads, according to the available data) and Abstracts Views on Vision4Press platform.
Data correspond to usage on the plateform after 2015. The current usage metrics is available 48-96 hours after online publication and is updated daily on week days.
Initial download of the metrics may take a while.