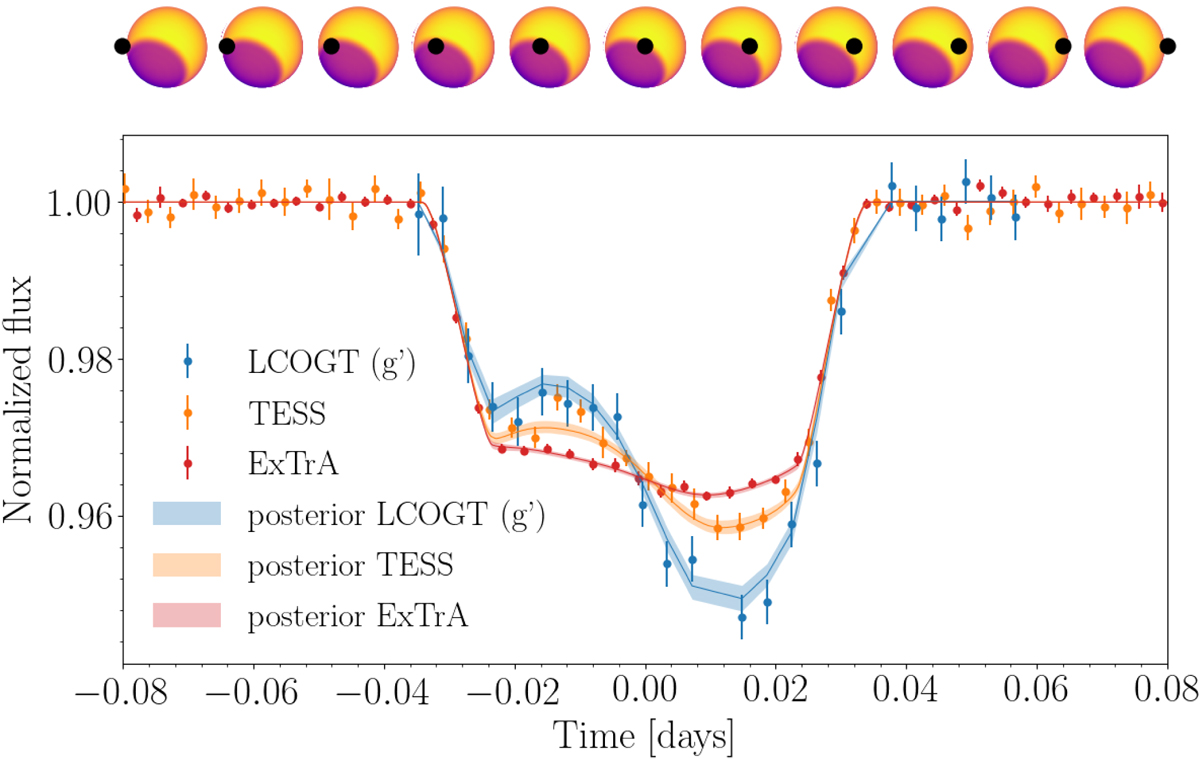
Fig. 1.
Download original image
Phased transits observed by LCOGT, TESS (only sectors 46 and 49), and ExTrA, and the posterior model of a planet transiting a star with a polar spot. For clarity, the figure only shows 5-min bins in the phased light curve for TESS and ExTrA. Above the panel: model of the stellar surface and the planet for the median posterior values, as seen by TESS at different times during the transit.
Current usage metrics show cumulative count of Article Views (full-text article views including HTML views, PDF and ePub downloads, according to the available data) and Abstracts Views on Vision4Press platform.
Data correspond to usage on the plateform after 2015. The current usage metrics is available 48-96 hours after online publication and is updated daily on week days.
Initial download of the metrics may take a while.