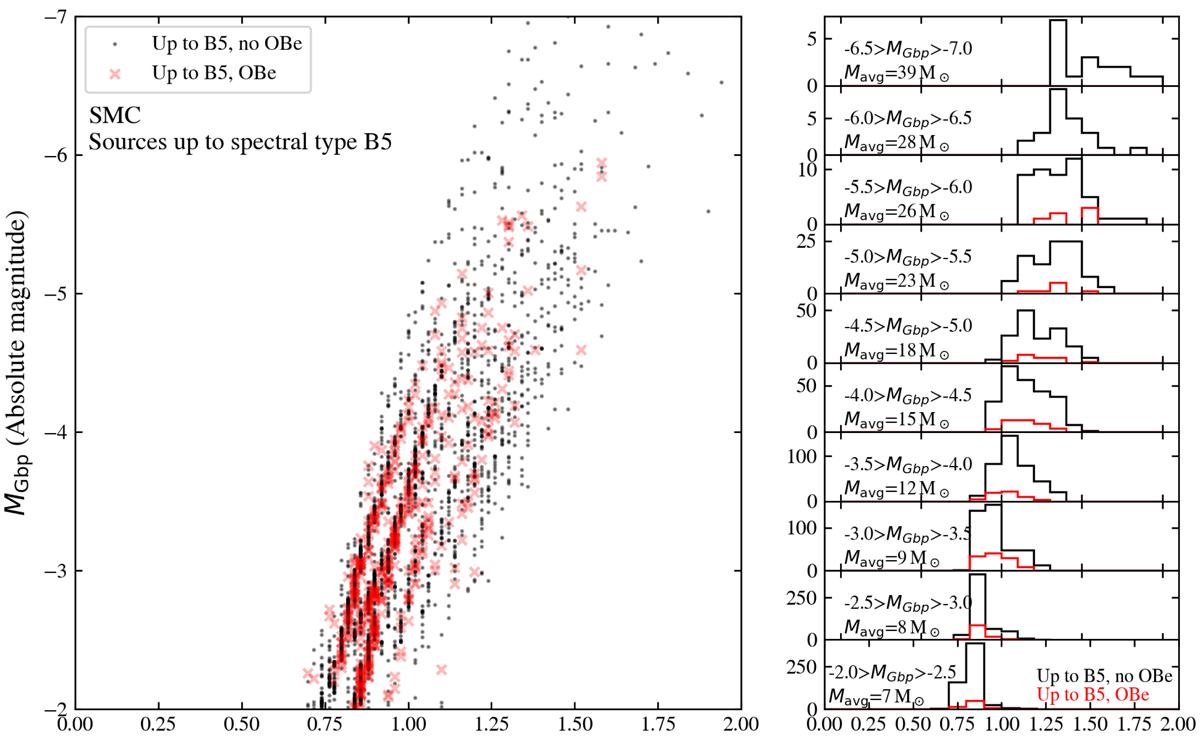
Fig. B.1.
Download original image
Left: Diagram showing the evolutionary mass Mevo of stars with spectral types B5 and earlier plotted against absolute magnitude MGbp, for both stars with (OBe) and without (MS) emission features in their spectra. The spectral type catalog is from Bonanos et al. (2010) and the evolutionary masses were determined by Schootemeijer et al. (2021). Right: Histograms that show the evolutionary mass distributions of the sources that are displayed in the left panel, in different MGbp intervals. The average evolutionary masses of sources in these magnitude intervals (i.e., OBe and MS) are written in each panel.
Current usage metrics show cumulative count of Article Views (full-text article views including HTML views, PDF and ePub downloads, according to the available data) and Abstracts Views on Vision4Press platform.
Data correspond to usage on the plateform after 2015. The current usage metrics is available 48-96 hours after online publication and is updated daily on week days.
Initial download of the metrics may take a while.