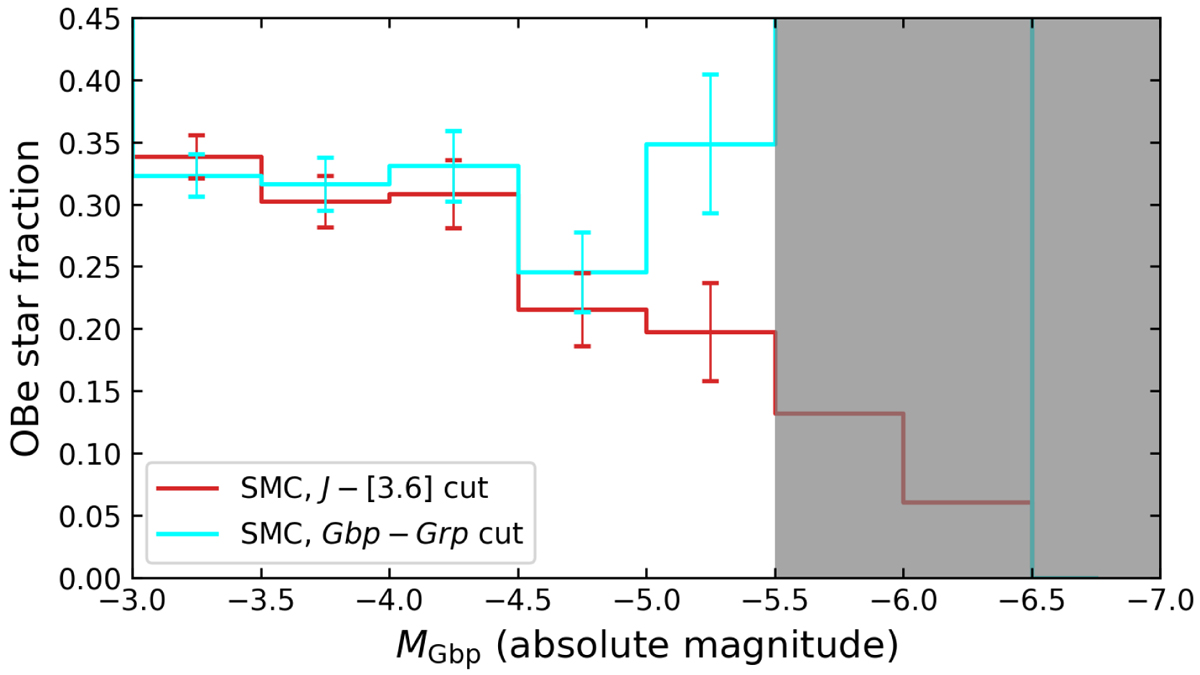
Fig. A.7.
Download original image
OBe star fraction in the SMC as a function of absolute magnitude. The red line shows the result obtained using a color–color cut with the J − [3.6] color on the x-axis (shown in Fig. 2). As a test, with a cyan line we also show the result obtained when the Gbp − Grp color is used on the x-axis instead (shown in Fig. A.5). In the grey shaded area, we do not present an OBe star fraction.
Current usage metrics show cumulative count of Article Views (full-text article views including HTML views, PDF and ePub downloads, according to the available data) and Abstracts Views on Vision4Press platform.
Data correspond to usage on the plateform after 2015. The current usage metrics is available 48-96 hours after online publication and is updated daily on week days.
Initial download of the metrics may take a while.