Fig. 1.
Download original image
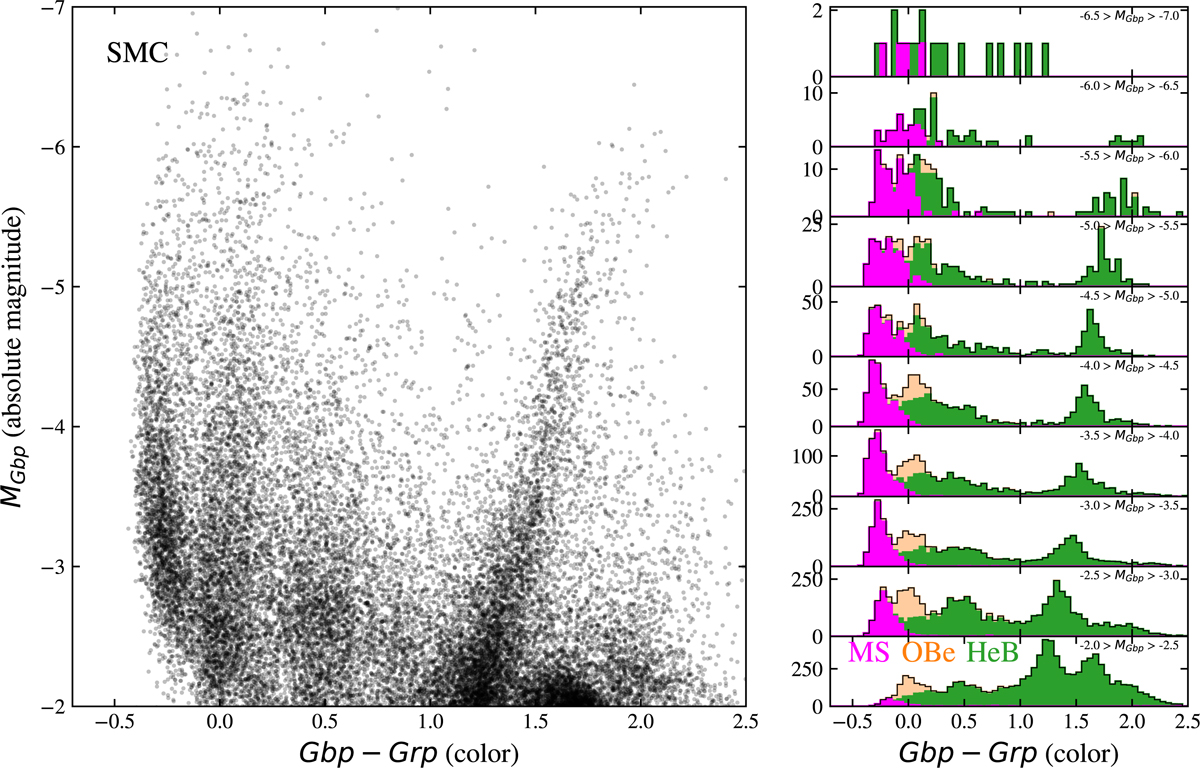
Left: color magnitude diagram of stars in the SMC, constructed with Gaia filters. Each black dot represents a source. The brightest sources are at the top and the bluest sources are on the left. We adopt a value of 18.91 for the distance modulus (Hilditch et al. 2005). Right: Stacked histograms of the Gbp − Grp color in the absolute magnitude ranges that are written in the top right of each panel. Main sequence stars are shown in magenta, OBe stars in light orange, and He-burning stars in green. The black line shows the number distribution of all the sources combined.
Current usage metrics show cumulative count of Article Views (full-text article views including HTML views, PDF and ePub downloads, according to the available data) and Abstracts Views on Vision4Press platform.
Data correspond to usage on the plateform after 2015. The current usage metrics is available 48-96 hours after online publication and is updated daily on week days.
Initial download of the metrics may take a while.