Fig. 7.
Download original image
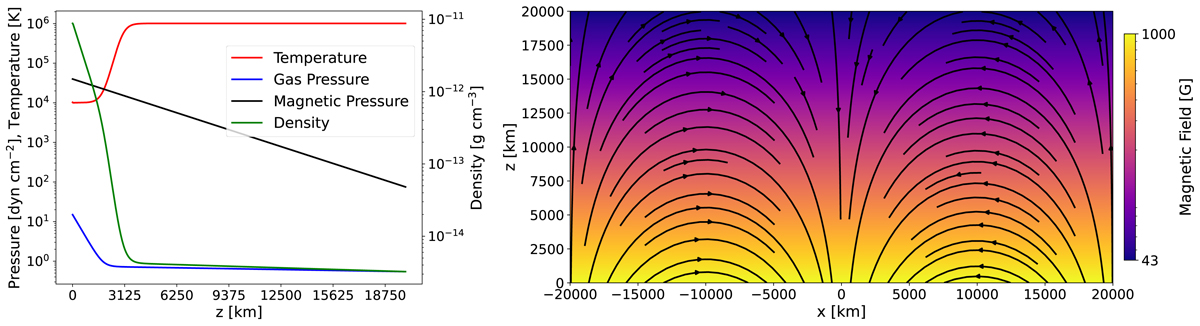
Initial conditions for the simulation. Left panel: temperature (red line), density (green line), gas (blue line), and magnetic pressure (black line) stratification along the z direction considering a constant value of 274 m s−2 for gravity. Right panel: symmetric potential magnetic field configuration. The background colour denotes the intensity of the magnetic field while the solid black lines show some representative magnetic field lines.
Current usage metrics show cumulative count of Article Views (full-text article views including HTML views, PDF and ePub downloads, according to the available data) and Abstracts Views on Vision4Press platform.
Data correspond to usage on the plateform after 2015. The current usage metrics is available 48-96 hours after online publication and is updated daily on week days.
Initial download of the metrics may take a while.