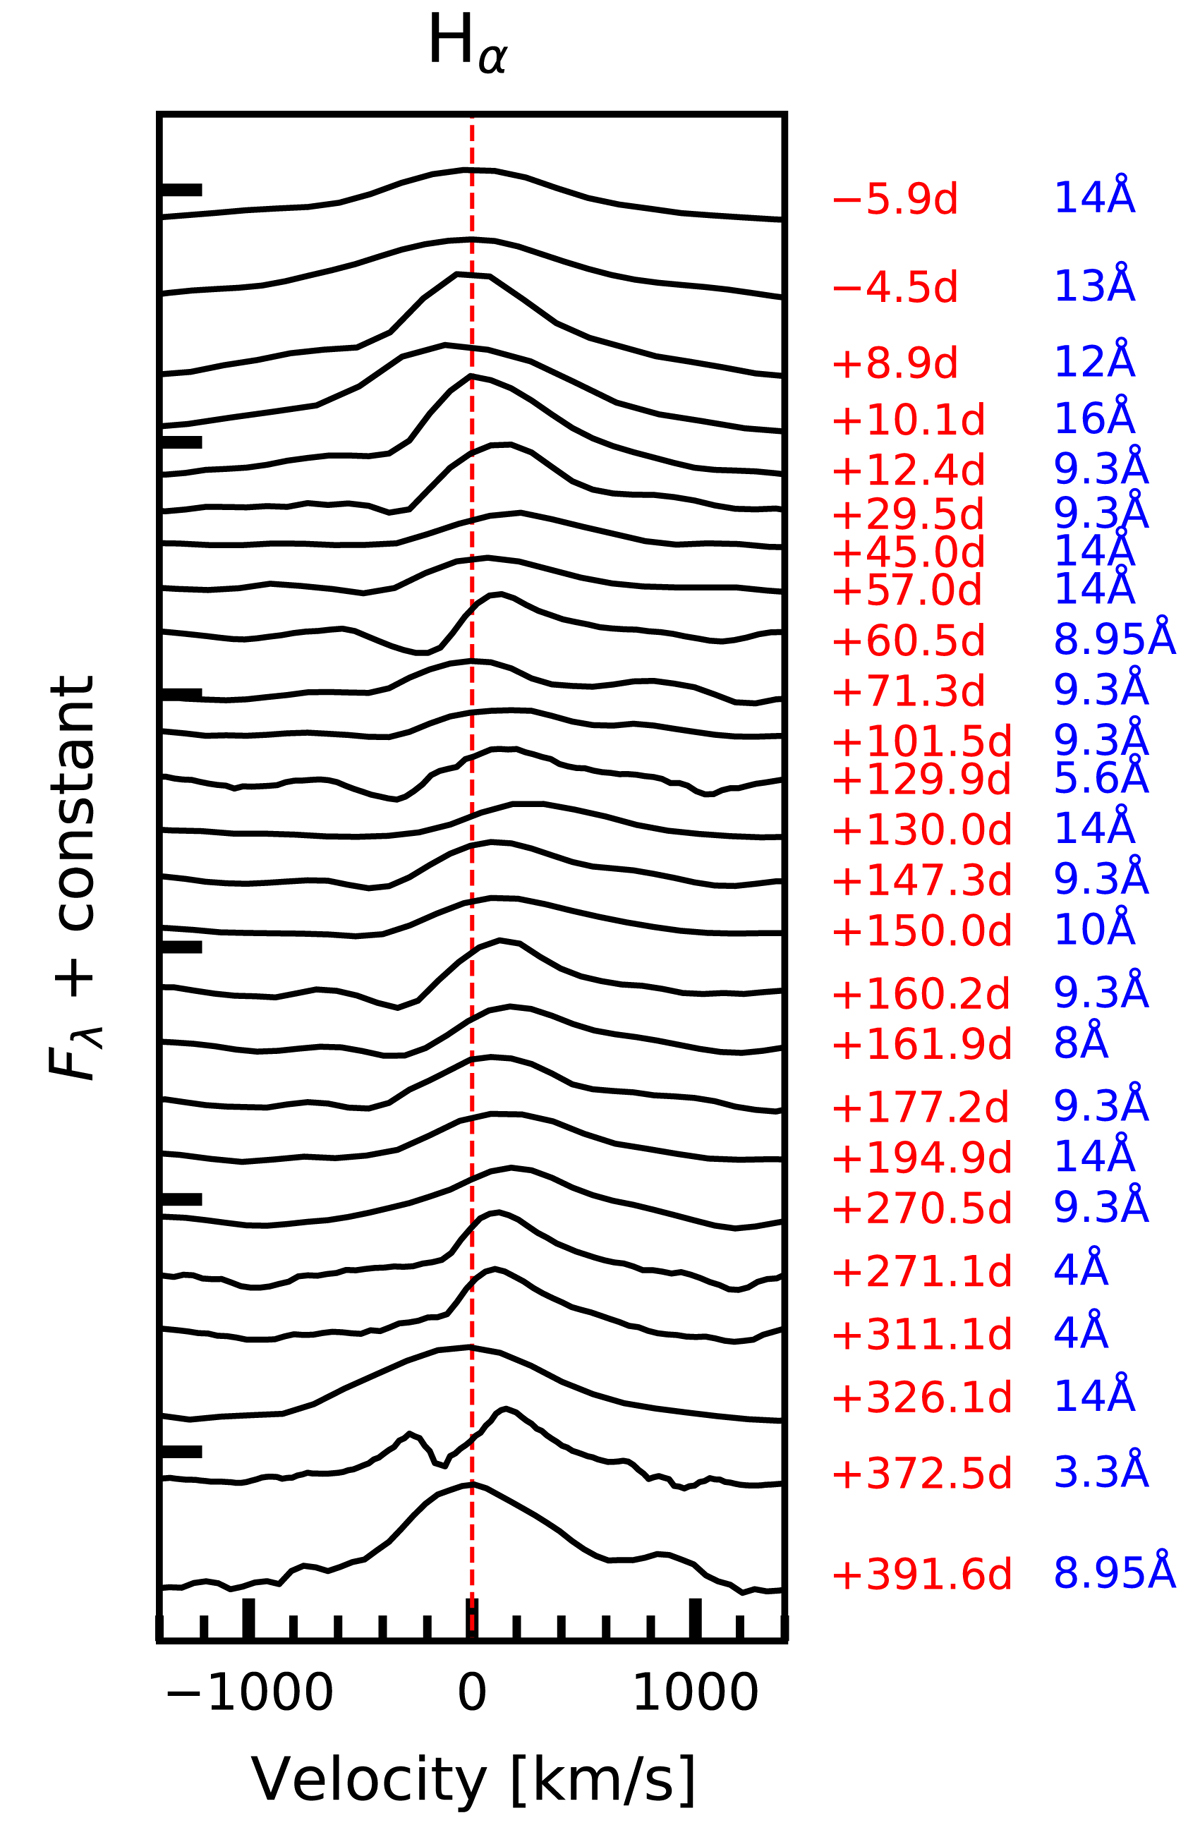
Fig. 8.
Download original image
Evolution of the Hα profile of AT 2021biy. The Hα lines are shown in velocity space, with zero velocity marked by a red dotted line. Phases (red colour) and resolution (blue colour) of each spectrum are labeled on the right-hand side. Phases are relative to r-band maximum. All of the spectra are corrected for redshift and reddening. Note that some low-S/N spectra are not shown in this figure.
Current usage metrics show cumulative count of Article Views (full-text article views including HTML views, PDF and ePub downloads, according to the available data) and Abstracts Views on Vision4Press platform.
Data correspond to usage on the plateform after 2015. The current usage metrics is available 48-96 hours after online publication and is updated daily on week days.
Initial download of the metrics may take a while.