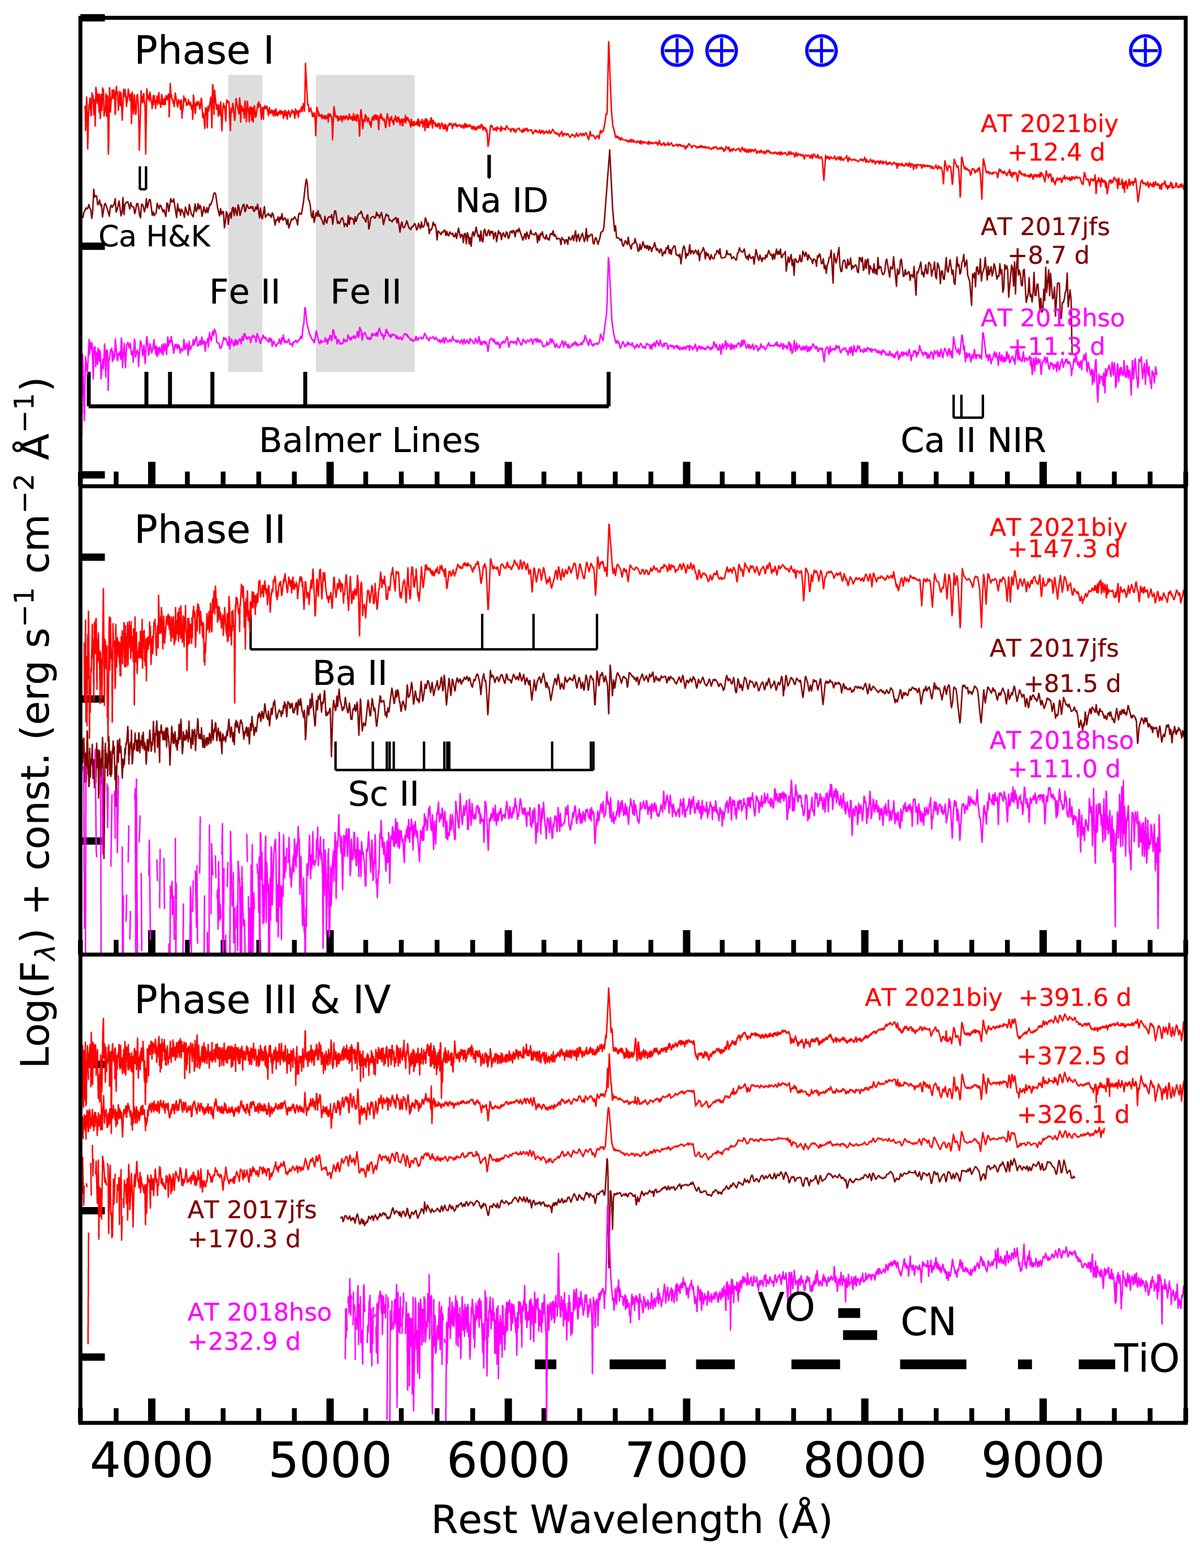
Fig. 7.
Download original image
Spectral comparison of AT 2021biy with LRNe AT 2017jfs and AT 2018hso. The spectra were selected at three distinctive phases: Phase I – soon after the first blue peak (top panel); Phase II – around the second red peak/plateau (middle panel); and Phase III – at late epochs (bottom panel). Two spectra taken during the late light-curve hump (Phase IV) are also shown in the bottom panel. The principal lines in the LRN spectra are marked, following the identifications of Pastorello et al. (2019a,b, 2021a,b), and Stritzinger et al. (2020a). All spectra have been corrected for redshift and reddening.
Current usage metrics show cumulative count of Article Views (full-text article views including HTML views, PDF and ePub downloads, according to the available data) and Abstracts Views on Vision4Press platform.
Data correspond to usage on the plateform after 2015. The current usage metrics is available 48-96 hours after online publication and is updated daily on week days.
Initial download of the metrics may take a while.